
Me: “I’ll take Python for $200, Trebek.”
Trebek: “The time it takes for you to create a hand-coded XIRR calculation in Python for use in Tableau’s TabPy?”
Me: “What is ‘a long time’?”
Trebek: “Correct!”
That’s right—you can now calculate XIRR in Tableau! But it’s not going to be easy, so buckle up.

First, let’s pause. The #1 recommended route here is to create a stored procedure to calculate XIRR. Why? Simple: it’s just a lot easier to manage. The world of Python + Tableau (TabPy) is exciting but is largely unsupported by Tableau. However, there are some scenarios in which it might make sense:
- You’ll never get direct access to your database to create a stored procedure to connect live.
- Connecting via a stored procedure is not an option because it’d be too slow (too much data).
- Ultimately the stored procedure is the path you’ll take, but due to external factors, it’s not immediately available.
Okay, I’ve warned you, and you’ve clearly ignored my warnings (or maybe you got distracted by that Jeff Goldblum GIF). If you’ve made it this far and are now wondering what TabPy is, or what XIRR is, I’ll point you in the direction of this excellent TabPy overview and IRR wiki.
If you’re looking for a simple IRR calculation, there’s a very easy method in Python’s NumPy library.
Data Structure
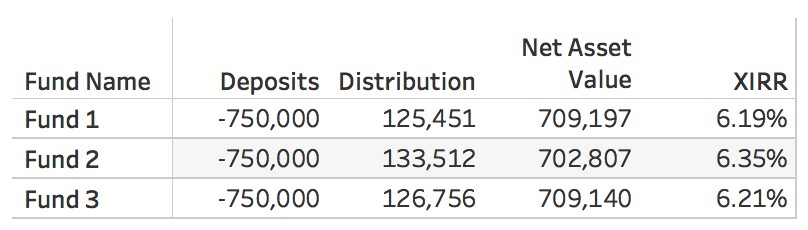
All right, caveats be gone. Let’s do this! You have your dataset, and you’ve already got your TabPy server set up. For this example, we’re going to try our best to recreate Excel’s XIRR() function, as it provides us with something to test against. You can see the way we have our sample dataset (found at the bottom of this post) structured in the image below. Deposits, Distributions and Net Asset Value are all in the same column. This allows us to manipulate the data more easily than if they were in different columns.
Note: It’s generally possible to calculate XIRR() with a different data structure, but since there are so many variations, this blog post just sticks to a standard columnar dataset.
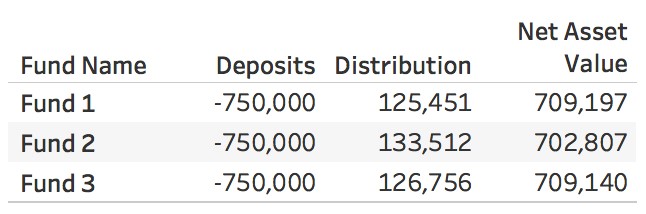
From this, we can see that we have three funds, all of which have required the same amount of deposits. We can also see that between $125,000-$133,000 has been paid out and $702,000 to $709,000 stand as the existing values. Not bad. We invested $750,000 in three rounds over the last three years and now have just over $100,000 from each fund.
Level of Detail
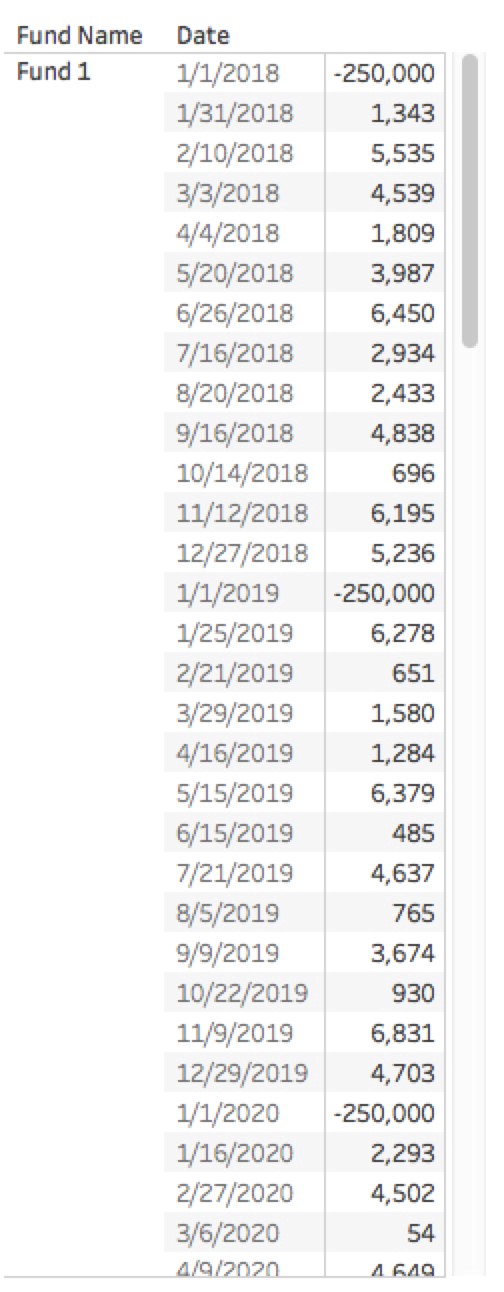
Now that we have an idea of where our money started and ended, we’d like to know how we got here. What’s our internal rate of return? In order to find this, we need to send each individual date and distribution to TabPy for processing, which means we need our level of detail to show us the individual dates. Consequently, we need to add Dates to our Rows and remove the Type because we want to send all cashflows at once to our Python calculation:
XIRR Calculation
Now that our level of detail is correct, we can successfully compute XIRR. This is where the Python calculation comes in! You can download the Python file at the end of this post to paste into your calculated field. But before we get there, I want to highlight the functions being used here:
- eir_derivative_func()
- eir_func()
- xirr()
The first two functions here are helper functions to get to the XIRR(). If you’d like to learn more about the calculus that goes into these functions, there are references at the bottom of this page, as well as inline in the code.
To briefly explain the xirr() calculation: after making a couple of checks to make sure the payments and dates meet our criteria, we grab the discount rate using eir_func(), then find the derivative using eir_derivative_func(). Lastly, we return the result of Newton’s Method to give us XIRR.
One more thing to note is that your data may not be shaped as above and may need re-shaping. One example in this code is the need to re-format the dates. They come into Python as Unicode, and that throws some errors with the functions mentioned above. You may need to create helper functions, similar to multi_format_date_parse(), in order to get your data into the correct shape or format, especially if your data doesn’t fit neatly into two columns.
Now that you’re aware of the complexity here, let’s do the simplest part. Copy and paste your code into a calculated field and drop it on your viz!
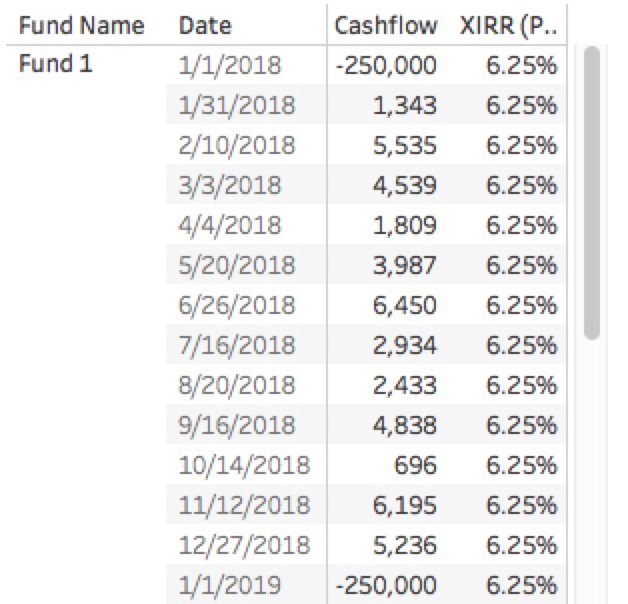
Table Calculation Logic
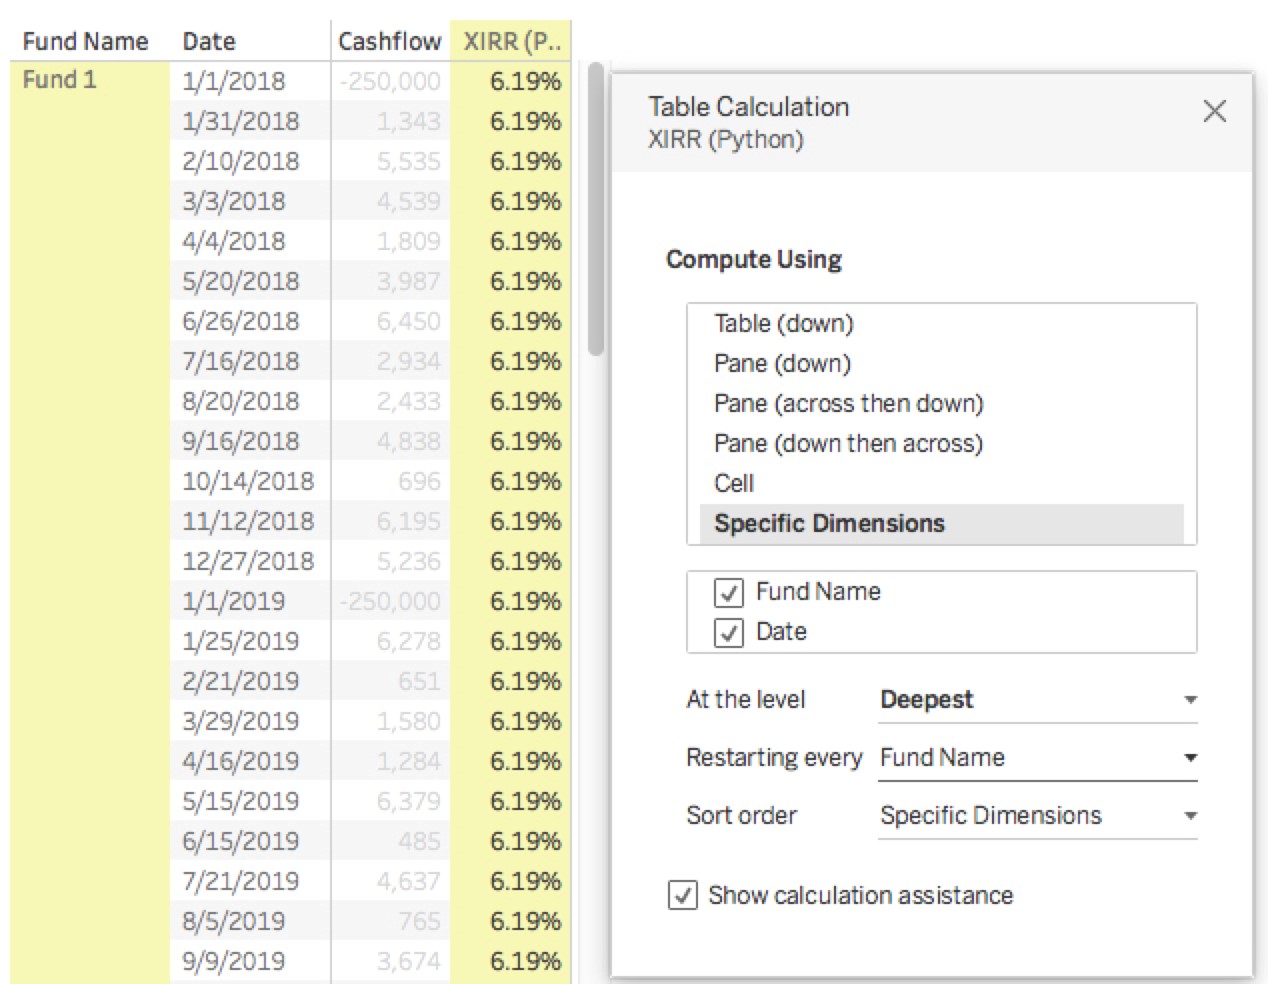
Now we’ve got the XIRR, right? Not quite. We need to make sure our TabPy calculation is addressing the right partitions (which is the same thing as making sure our Table calculations are using the correct compute using). You may run into some issues while trying to get the right compute using. However, this issue post on GitHub helped point me in the right direction. In this case, we need to adjust our Python calculation to address Date and Fund Name and restart every Fund Name.
Now for the final step. We need to leave all the dates on the viz, but we can just hide them using a table calculation LAST() and set it to equal 0. Conveniently, this is also our NAV value:
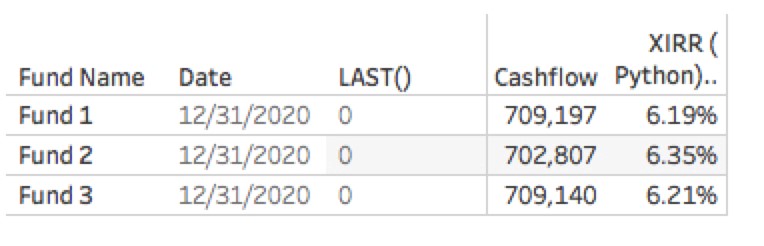
And finally, after some more level-of-detail magic, we can have a cleanly formatted financial statement showing the performance of all our accounts:
Maybe that “Jurassic Park” quote is ringing in your ears now, or maybe you’re ready to take this on. Either way, there’s a lot of flexibility and customization to be had with Tableau’s TabPy. If nothing else, it makes for a really fun side project to get to know Python a little better. Happy coding!
To find references for the calculus behind eir_derivative_func(), eir_func(), refer to the links below: