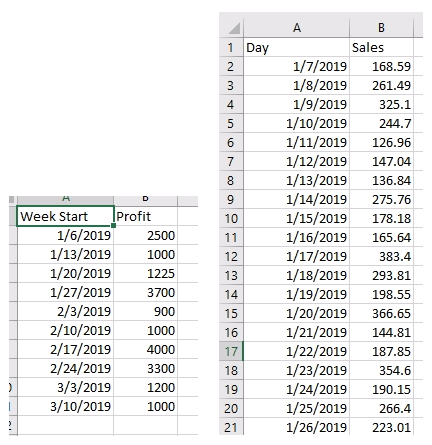
As a follow-up to my prior blog post, I wanted to explore an additional use case for aggregation in Tableau: joining together data that might be at different date levels. It’s the same premise—you have two data sources at two levels of detail (e.g. row-level transactions vs. regional goals; employee-level vs. team-level), but the steps to aggregate that data are slightly different.
In this example, we have weekly profit data, as well as daily sales data. Our end goal is to return three columns with our daily sales rolled up to the weekly level so that we can compare it against our profits:

Since one data source is at the weekly level, and one is at the daily level, adding an aggregation will be necessary to return data at the correct level.
When Aggregation is Necessary
A rule of thumb for aggregation: your data sources must be aggregated so that they match the data source with the highest level of aggregation. In our example, we have our data split out by week and by day. We couldn’t reliably break our weekly data down to the daily level since we don’t know what days each profit occurred on, so we should aggregate our daily data to the weekly level.
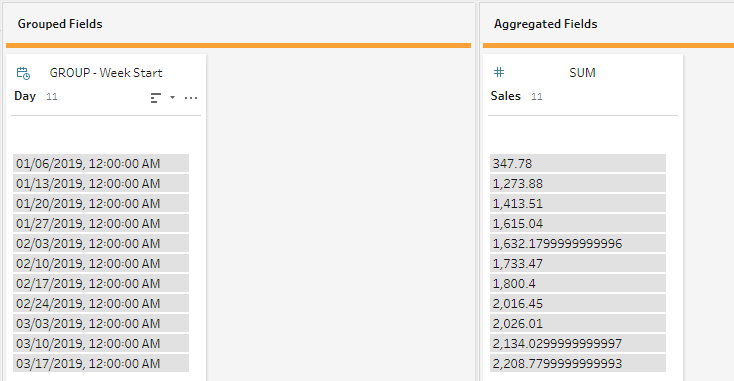
Once we add an Aggregate step, we need to specify what fields we are grouping by and what we are aggregating:

Click on the word Group next to your data type icon to change your “Group By” level to “Week Start” so it matches our Weekly target data. If you want to read more about how Tableau treats our different options, check out this video from my colleague, Katie! Next, we can add a Clean step and join our two data sources together on our two date fields to get our final data source:

Hopefully this clears up any questions you have about how to tackle situations where you might have data at two different date levels. Cleaning it up in Prep before you bring it into Tableau Desktop will make your life infinitely easier by minimizing the need for calculations. Thanks to Kent Sloan for assistance on this blog, and thanks for reading!

