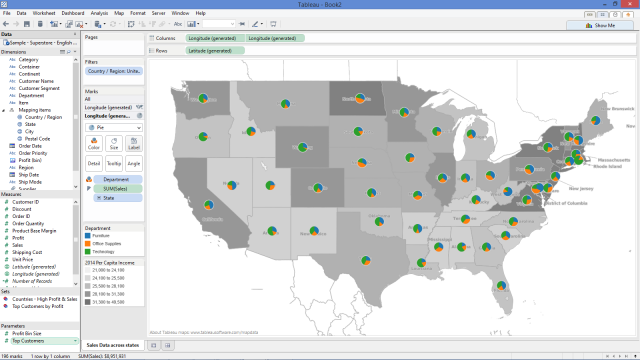
Some of you may have come upon this problem:
You can’t see where the states or their boundaries are.
Why is that you may ask? Tableau overlays what are called “Map Layers.” These layers allow you to overlay names, state boundaries, zip code boundaries and much more. In addition to map layers, Tableau can also overlay “Data Layers.” Data layers are statistics that are pulled from U.S. census records. They can also overlay on top of your map.
How can you customize your map to show only what is relevant to you? This is how:
1. Create Your Map
Start by putting Longitude on Columns and Latitude on Rows.
NOTE: Your map will look different because my map has a dual axis on it.
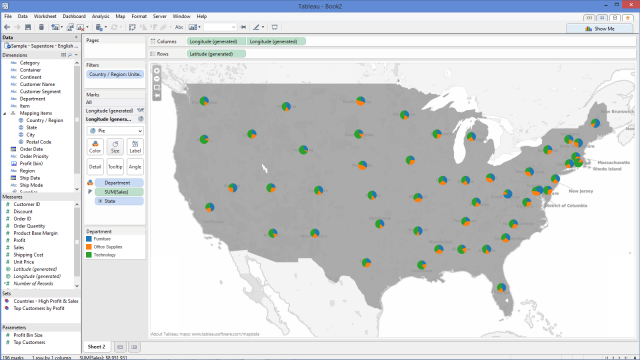
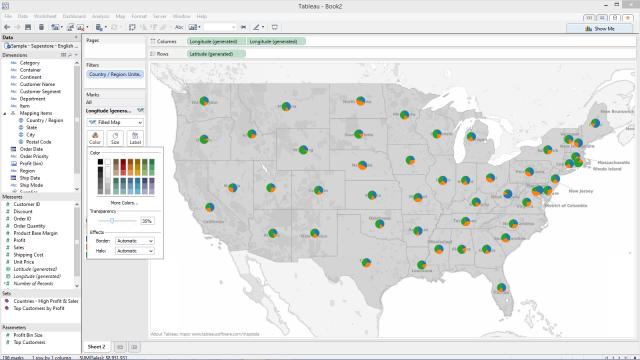
2. Lower Map Color Transparency
To lower the color transparency, go to your Marks Card and click on Color.
3. Select Map Options
In the menu at the top, click on Map >> Map Options. A menu on the left-hand side will appear that says Map Options.
NOTE: Make sure your map is online first. To check, click on Map >> Background Maps >> Online.
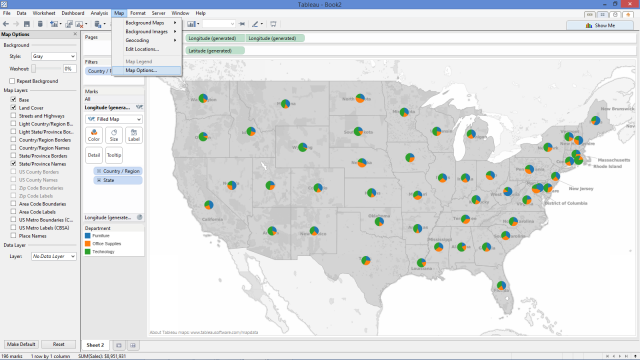
4. Customize Your Map Layers
Click on the map layers to customize your map. Below is a list of what each map layer does.
|
Layer Name |
Description |
|
Base |
Shows the base map, including water and land areas. |
|
Land Cover |
Shades wilderness areas and parks to give the map more depth. |
|
Streets and Highways |
Marks freeways and highways as well as small city streets. This layer also includes the highway and street names. |
|
Light Country/Region Borders |
Shows a light gray outline of country/region borders and names. |
|
Light State Borders |
Shows a light gray outline of state borders and names. |
|
Country/Region Borders |
Highlights country/region borders in a darker gray. |
|
Country/Region Names |
Highlights country/region names in a darker gray. |
|
State/Province Borders |
Highlights state and province borders in a darker gray. |
|
State/Province Names |
Highlights state and province names in a darker gray. |
|
US County Borders |
Highlights U.S. county borders. |
|
US County Names |
Highlights U.S. county names. |
|
Zip Code Boundaries |
Marks U.S. zip code boundaries. You must zoom in to see this layer. |
|
Zip Code Labels |
Shows labels for U.S. zip codes. You must zoom in to see this layer. |
|
Area Code Boundaries |
Marks the U.S. area code boundaries. You must zoom in to see this layer. |
|
Area Code Labels |
Shows labels for the U.S. area codes. You must zoom in to see this layer. |
|
US Metro Boundaries (CBSA) |
Marks U.S. Metropolitan Statistical Areas and Micropolitan Area boundaries. |
|
US Metro Labels (CBSA) |
Shows labels for the U.S. Metropolitan Statistical Areas and Micropolitan Areas. |
|
Place Names |
Displays the names of places; from country/region names and borders to city names, bodies of water, parks, universities and more. This layer is dependent on the zoom level. |
After you are done customizing, exit the Map Options menu by clicking on the “X” in the upper right corner of the Map Options panel.