The idea behind these reports is to allow the user to explore Medicare Part D Prescription claims across the country. In 2014, Medicare Part D had 40.5 million beneficiaries. That’s roughly 12 out of every 100 Americans, which equates to a lot of data. In order to use a data set under the Tableau public limit of 15 million records, I had to split this data into two regional groups.
How the Tableau Vizzes Work
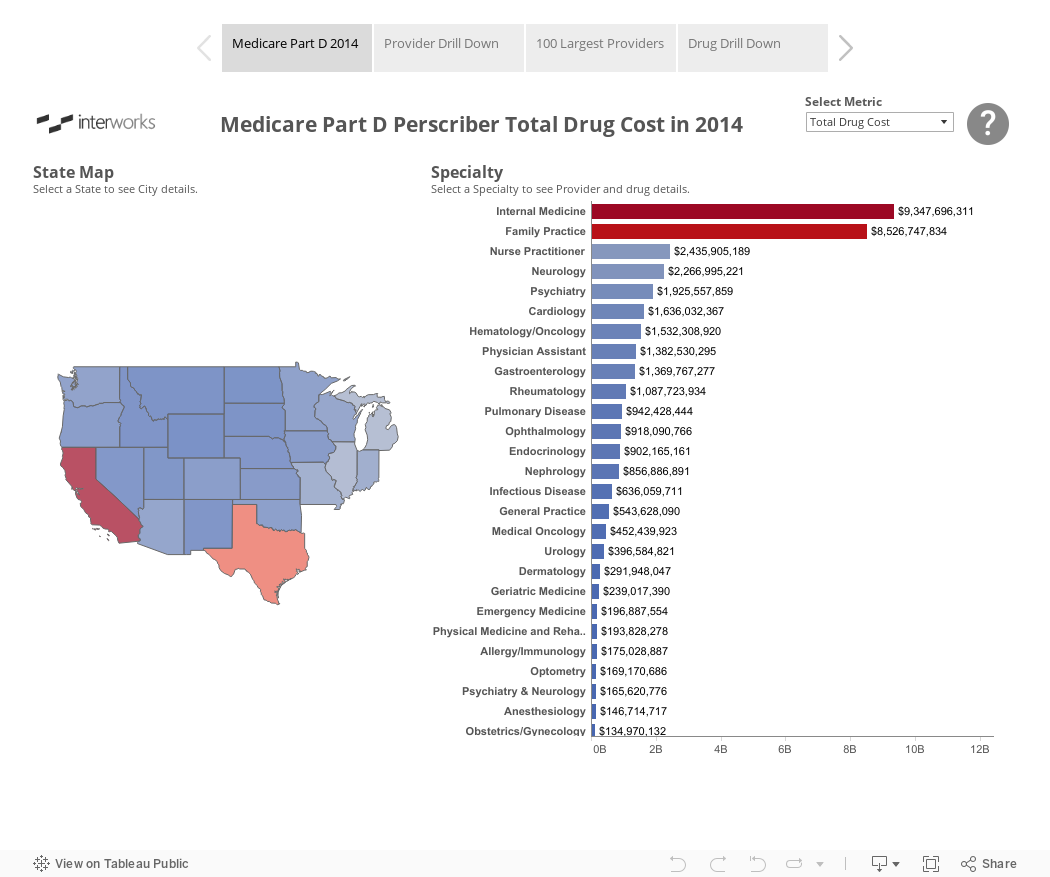
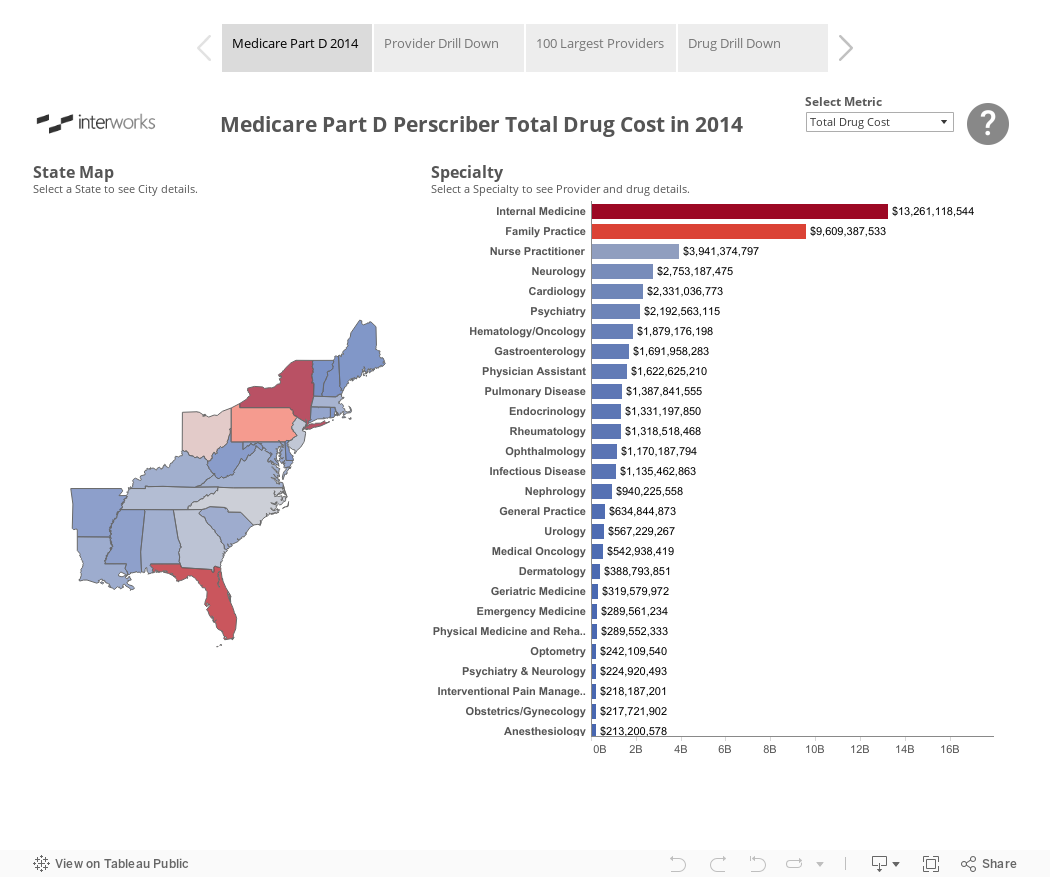
Each viz contains four different reports or drilldowns that can be toggled by clicking on the grey story points at the top of each viz. Each report has a slightly different focus, but the structure is more or less the same across the board, containing a filled map by state and a bar chart by specialty based on the metric selected in the filter at the top-right corner of the viz. As the user interacts with the viz, new information will appear.
Within any given specialty, you can view providers and drugs prescribed. Within any given state, you can break these numbers down by city. You can see a detailed list of available actions by clicking on the question mark at the top-right corner of each dashboard. There you’ll also find metric definitions and links to the data sources.
The point here with this structure is to give users new options as they continue to drill down vs. giving them all the options all at once. This structure also serves as a good example of how you can control load times on top of a very large data set by using action filters to focus what the user sees. Find your state below in one of the two vizzes and start digging in: