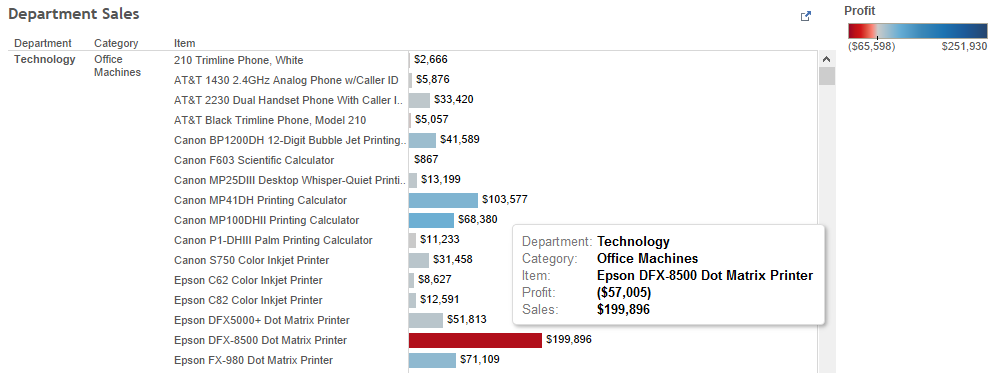
Hierarchies in Tableau are a great way to offer a high-level summary with the option to drill down into the data. For example, in the Sample Superstore extract, you can go from feeling great about Technology sales to worrying about losing money on DFX-8500 printers in seconds!

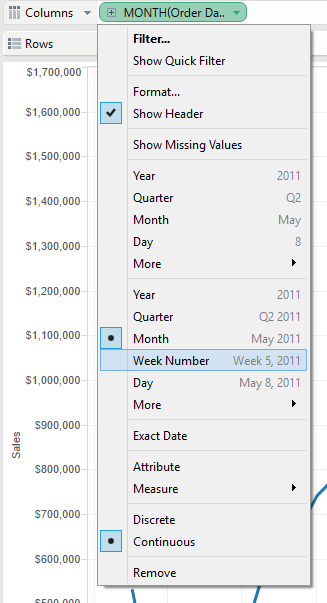
In line charts, you can drill down inside of a date variable by selecting the + but are not given a – to return to higher date parts. Currently, the user must hit the back button or edit the pill in the worksheet to return to the original view.

Below are examples of two workarounds that allow the user to drill down and up inside of a date by using a parameter built using the Sample Superstore extract. Open the attached workbook or open up a new Tableau workbook and connect to the Superstore extract to follow along.
Option 1: Calculated Field
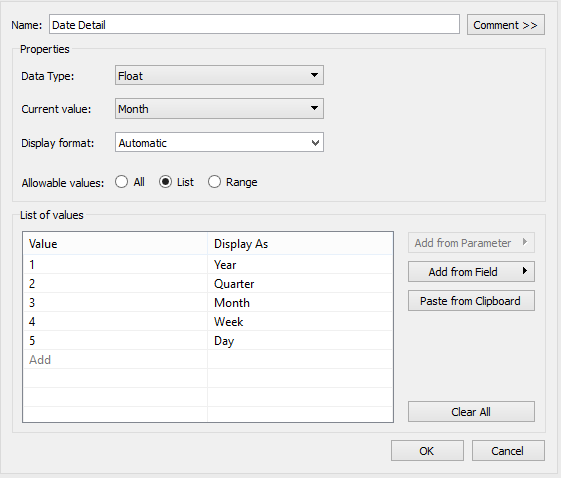
First, create a parameter with variables to represent each of the date parts you want users to be able to select from.
Next, create a calculated field that truncates the date variable for the line chart based on the parameter selected.
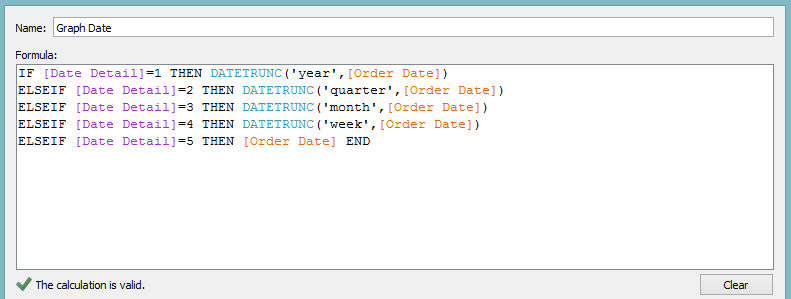
Use the new Graph Date variable in place of the original Order Date in the line chart and set the displayed date part to day. With this, you can now use the parameter to drill down and up inside of a date range.
Pros:
- Even if users click on the plus sign at the end of the date axis, the chart stays the same.
Cons:
- A single date format must be selected to be used across all date parts.
- You have to find a place for an additional drop-down on the dashboard.
Option 2: Swap Worksheets
Create the Date Detail parameter the same as shown above if not done already. Then, create a worksheet for each date part with the Order Date variable set to match.
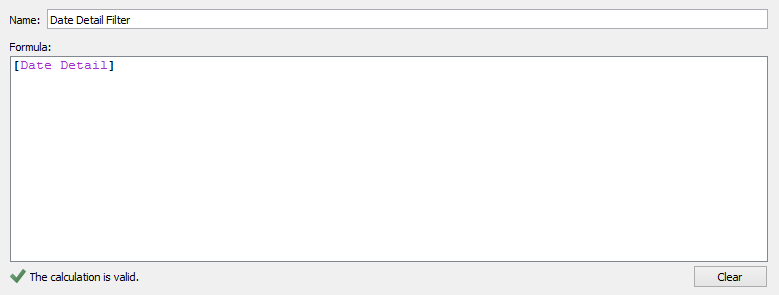
Once there is a worksheet set up for each date part, create a new calculated field to filter which date part is displayed.
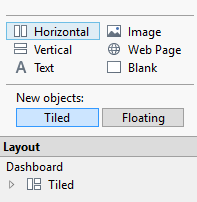
In a new dashboard with a Tiled layout, add a horizontal container to the dashboard.
Add the first date part worksheet to the container and display the Date Detail parameter. Adjust the Date Detail parameter to the date part of the added worksheet, then go back to the sheet. Place the calculated field Date Detail Filter under Filters and select the parameter value that matches the date part.
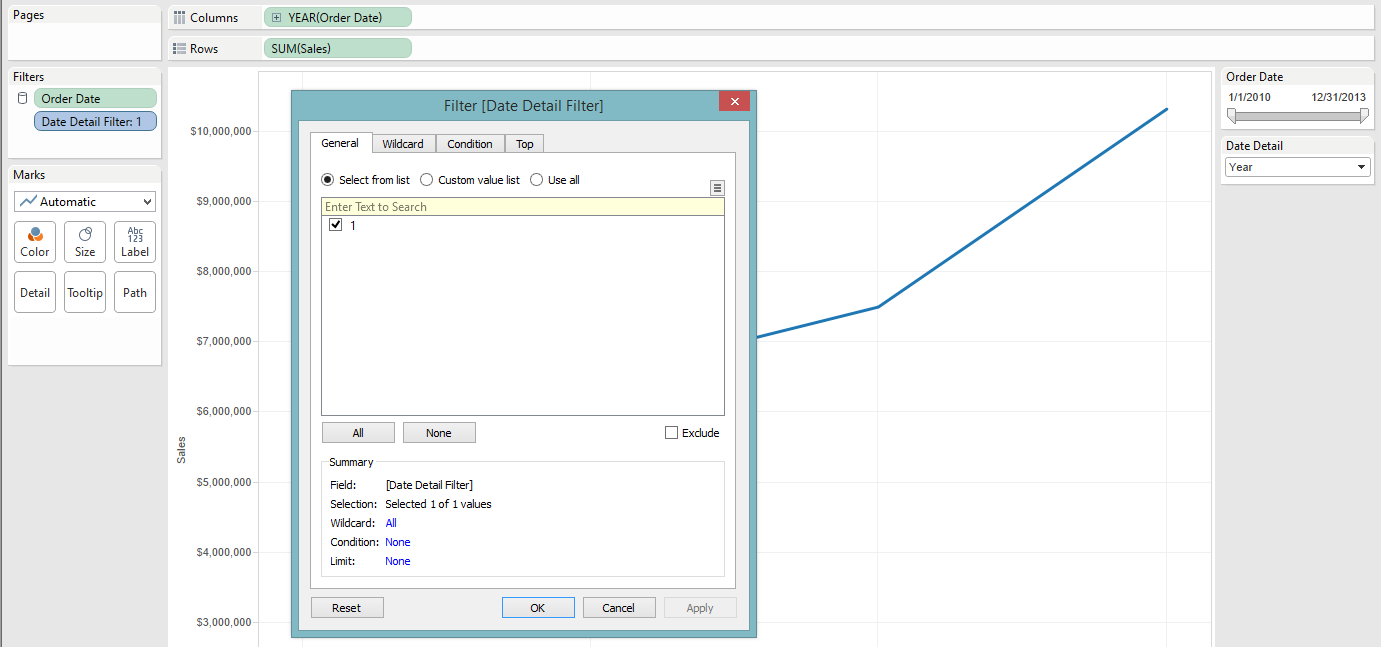
Test that this was done correctly by adjusting the Date Detail parameter and checking if the worksheet goes blank when a different date part is selected. Repeat this for each of the date part worksheets. Once all of worksheets have been added in and are working correctly, hide the titles for the worksheets and add a new title across the top.
Pros:
- The date format for each date part can be customized.
Cons:
- This is more complicated than the first option to set up.
- A small blank space is taken up by each worksheet even when hidden.
- This can be “broken” by users who click on the + at the end of the date axis.
- You have to find a place for an additional drop-down on the dashboard.

