
Normally when I build a dashboard, I approach it like a funnel: I start with the big picture first and then narrow into more specific details. This allows viewers to establish context and get the most important insights right from the start and then choose how deep to dive into the details. But when I tried this approach on my most recent Viz for Social Good project, it utterly failed.
The latest iteration of Viz for Social Good featured a data set about human trafficking, focusing primarily on where and why people are being trafficked. When I initially reviewed the data, I thought it was a perfect opportunity to build my first Sankey chart, showing the flow of people to and from different regions of the world.
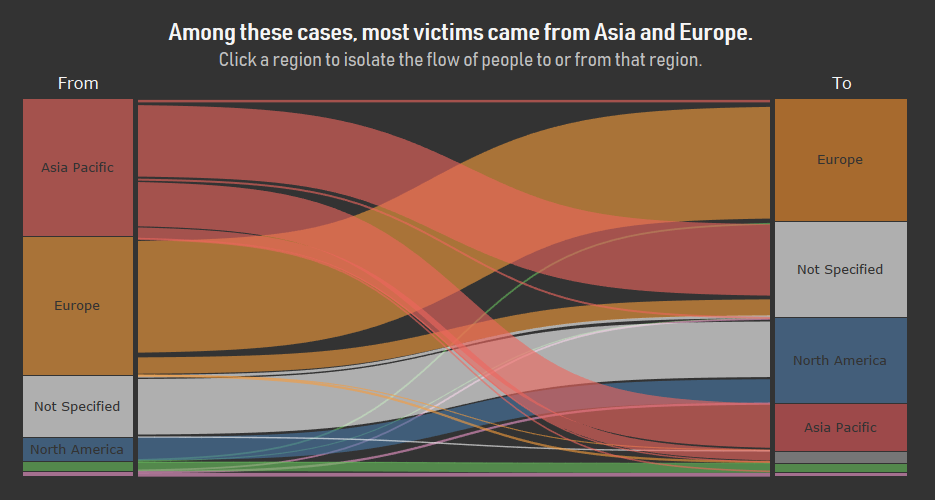
But the chart didn’t feel very compelling at the regional level – it basically just showed that a lot of people are being trafficked from Asia and within Europe. My quick attempt to change the chart to show flows at the country level looked busy and overwhelming (although Neil Richards submitted a country-level Sankey a few days later that was much better than mine).
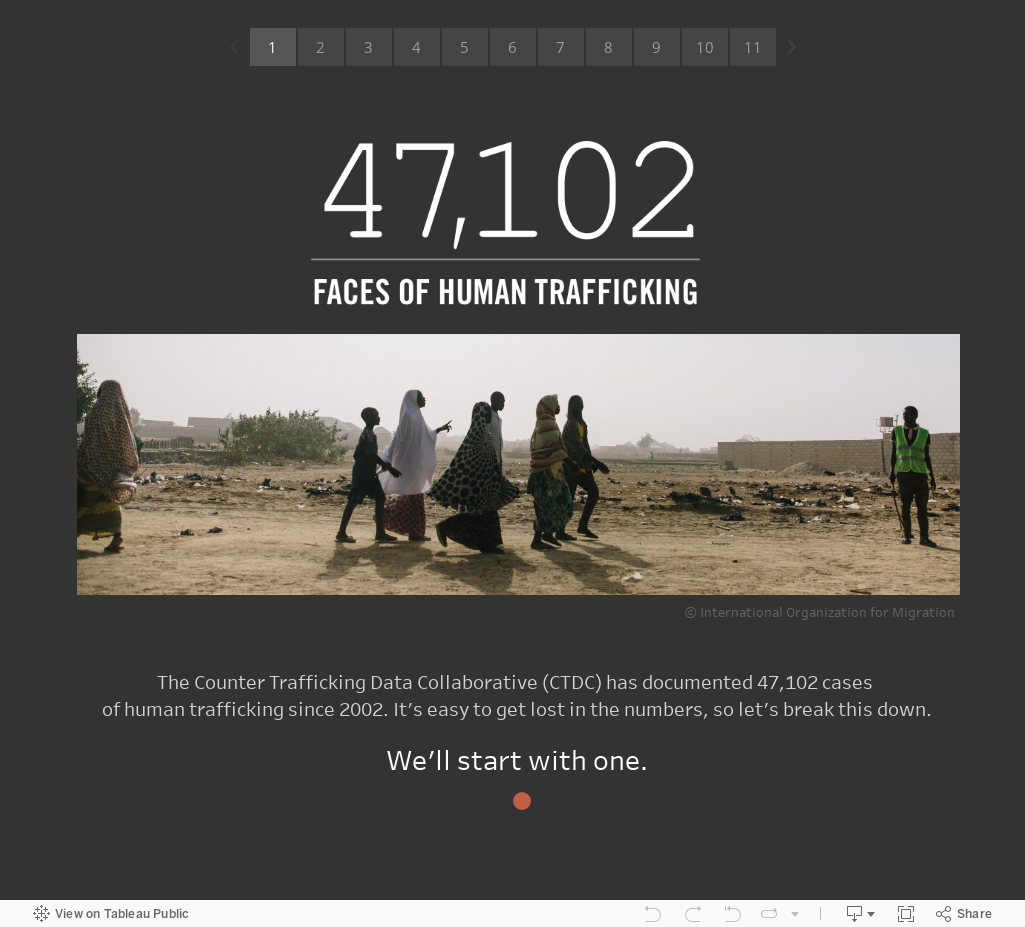
As I thought about how to improve the data story, I realized that it felt uncompelling because it was too broad – just a bunch of big numbers that felt impersonal even though they represented real human beings. So, I flipped the script and started small, focusing on one trafficking victim and building the story from there. I felt that this approach did a better job of conveying the magnitude of human trafficking and humanizing the subject.
P.S. In case you’re unfamiliar with it, the Viz for Social Good project was started by Chloe Tseng and periodically releases a data set from a nonprofit organization. Anyone can participate in the project; just download the data set and find a way to visualize it. Then, submit your visualizations on Twitter using the #VizforSocialGood hashtag to spread the word about the nonprofit’s cause and give the nonprofit some new ways to tell their story. Check out the Viz for Social Good website to participate in their next project.