
Over the course of the summer, the InterWorks team of business intelligence interns was provided with extensive training and internal work that helped them gain extremely valuable skills. These individuals—Fisher Ankey, JP Urrutia and Andrew Langford—teamed up on this blog post to chronicle their work over the summer.
Working with the Stillwater Chamber of Commerce
This summer, we also had the opportunity to conduct client work and provide solutions to an organization that was looking for a better understanding of their operation. That client was the Stillwater Chamber of Commerce.
In our initial meeting, we learned that the Chamber was looking to improve reporting across their organization in areas such as finance, community development and social media. Tableau was the obvious choice as the tool that could provide them the reporting power they needed, so we divided the work between the three of us. This process included collecting data from different sources, cleaning that data and positioning it in a structure that was usable for reporting. With Tableau, we created multiple dashboards, each one tailored to specific needs of the Chamber’s departments.
Finance
The finance portion of this project included connecting to a couple of different data sources, such as QuickBooks Online and Chamber Master. The QuickBooks Online data was used to view the Chamber’s income and expenses over time, while the Chamber Master data was used to report on memberships and retention within their organization.
QuickBooks Online
Using QuickBooks Online as a data source proved to be advantageous because Tableau has an embedded web data connector that allows users to sign in with their QuickBooks Online credentials and import the data into the workbook. This data was used to produce dashboards containing income and expense reports, as well as profit and loss, for the Chamber.
Each dashboard contains features to perform a deeper dive into the data through action filters and buttons. Each of these views gives the Chamber a quick, easy-to-access look at their finances at a YTD or month-by-month view. Lastly, because of the data connection to QuickBooks, the dashboards will update dynamically and eliminate the need for manual updates in the future.
Chamber Master
The Chamber Master site contained data regarding membership and retention. It is a quick overview of how the Chamber is tracking member count. Getting this data was not as easy as connecting to the data source in Tableau. However, Chamber Master allows a user to download report spreadsheets in a customizable format for the desired view. After exporting the data, the tables were combined using a union.
Just like the QuickBooks online dashboard, each of these dashboards contains filters and actions that allow the user to get a more in-depth understanding of the data. These reports were saved in Chamber Master and will allow the customer to export and reproduce future data with the same structure.
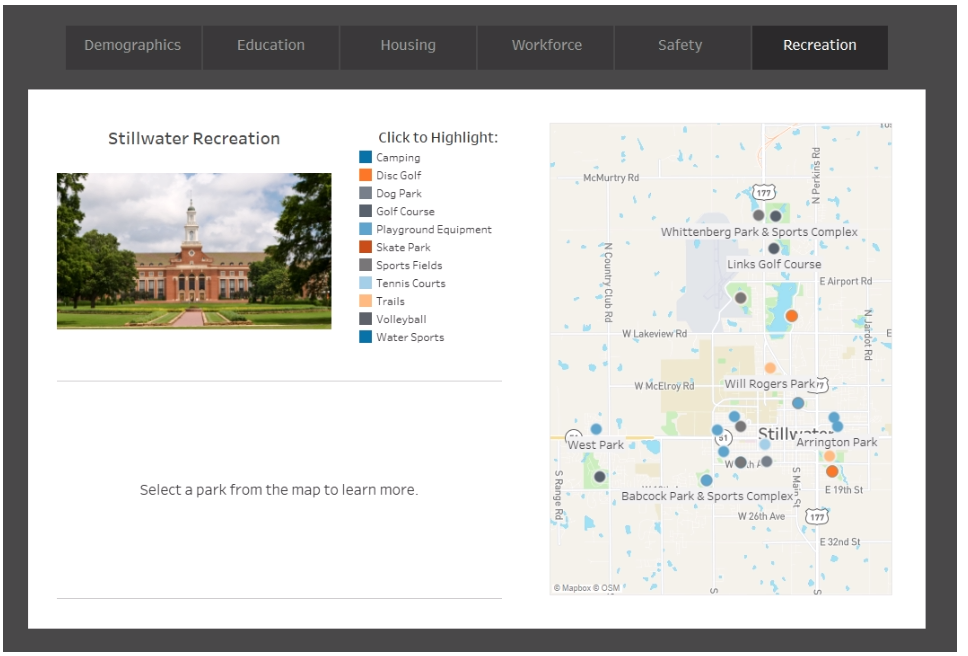
Community Dashboards
Along with financial information, our team also created a set of community dashboards to provide the Chamber a view of the Stillwater community at different levels. These levels include demographics, education, housing, workforce, safety and recreation. The data for these various community levels was collected from a lineup of private and public sector sources, such as the U.S. Census Bureau, U.S. Bureau of Labor Statistics, workreadycommunities.org and more:
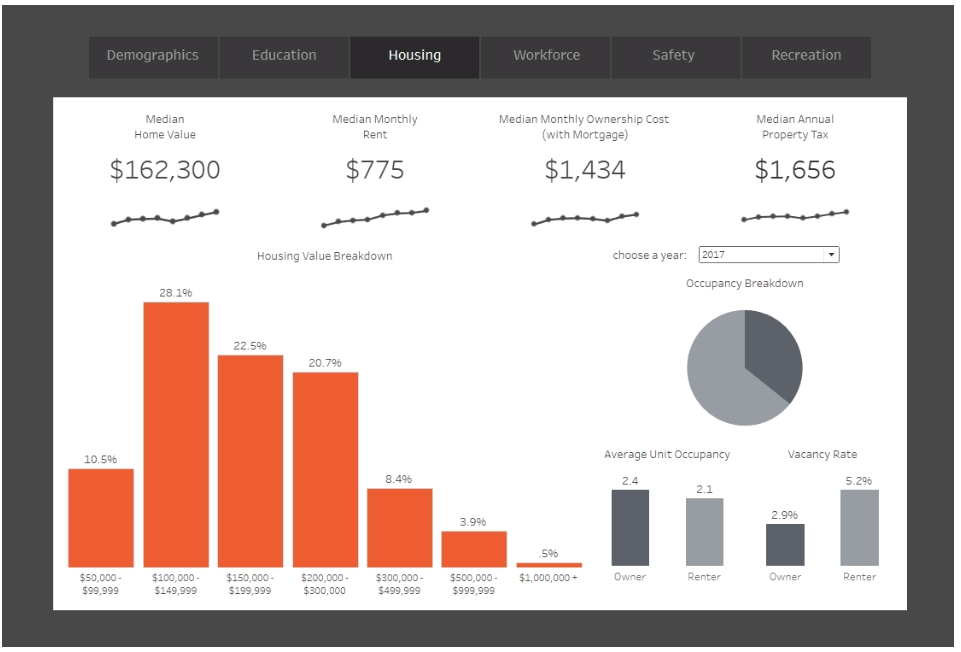
A task that proved just as important as gathering and cleaning the data was documenting how to access and update it. Each year, the various sources listed update their information to report upon the year prior. That means once a year, the Chamber of Commerce will have to manually update the underlying data that drives these dashboards. Just like the financial dashboards, the Chamber was provided documentation with step-by-step instructions on how to perform these updates.
Social Media
Lastly, the Stillwater Chamber of Commerce also wanted to understand the behavior and performance of each of the social media platforms the organization was using. So, we provided solutions regarding platforms such as Google Analytics, Facebook, Instagram and Twitter.
Google Analytics
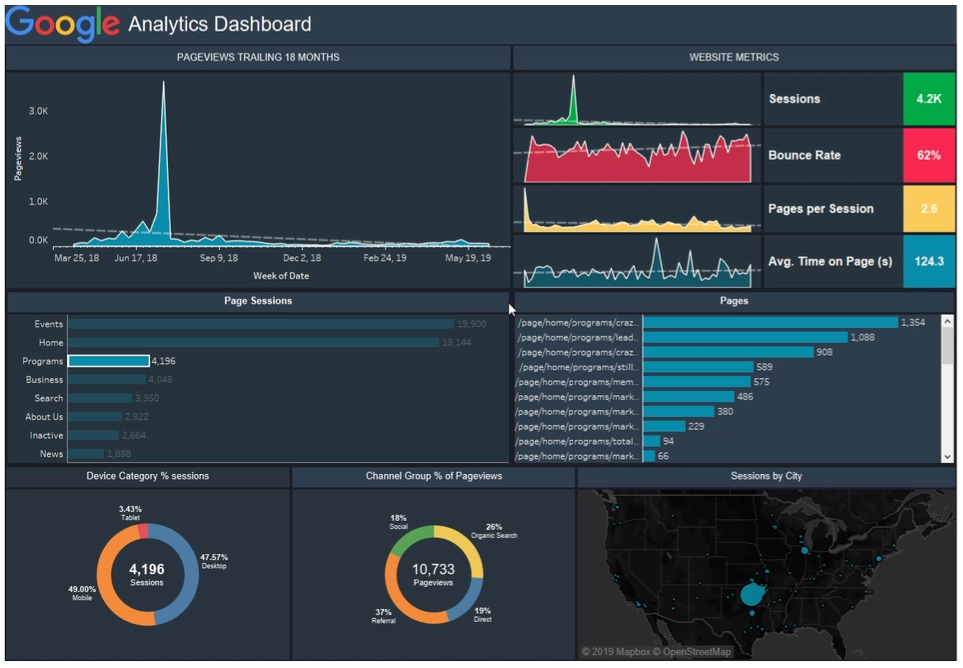
The Google Analytics dashboards provide information and insights regarding the Stillwater Chamber website and Grow Stillwater Google Analytics data. The dashboards contain data of the trailing 18 months to the current date and provide metrics at the website, page, device and location levels, including pageviews, sessions, bounce rate, time on page and more.
The same templates are built for both dashboards. Both connect to the Google Analytics web data connector built into Tableau, providing a cheap and simple way to extract data into the workbook. The data connector updates when the user updates the date parameter in the workbook’s data source tab. Each dashboard contains across-dashboard filtering that allows the user to specify web pages and see KPIs for a complete drilldown analysis:
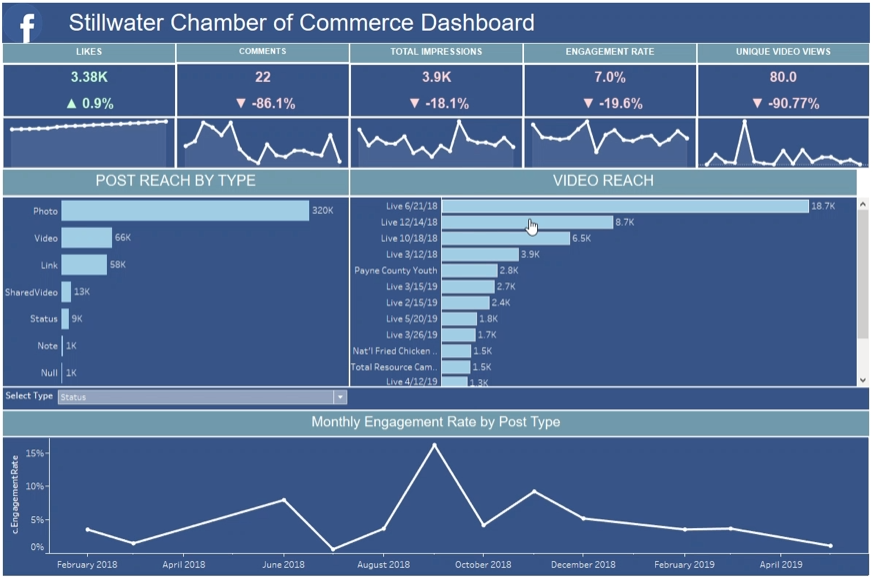
The data was exported from the Facebook Insights page. To add more data, the client would go to the Facebook profile > Insights tab > export data for each level at a specified date range. The downloaded file can be added by a union through Tableau or copy/paste in a Microsoft Excel sheet.
The Facebook dashboard provides information and insights regarding the Stillwater Chamber Facebook data. The dashboard contains data of the trailing 18 months to the current date and provides metrics at post, page and video levels, including page likes, post impressions, post engagement rates and more. These metrics show monthly performance for metrics such as comments, engagement rate and unique video views. Page likes and total impressions provide total numbers, but all of these are accompanied by monthly percent changes for the most recent month:
The data was exported from the Facebook insights page. To add more data, the client would go to the Facebook profile > Insights tab > export data for each level at a specified date range. The downloaded file can be added by a union through Tableau or copy/paste in a Microsoft Excel sheet.
The Twitter dashboard provides information and insight regarding the Stillwater Chamber Twitter page data. The dashboard contains data of the trailing 5 months to the current date and provides metrics at page and post levels including tweets, retweets, post engagement rate, and post URL clicks. These metrics show monthly performance for metrics such as tweets, retweets, engagement rate and URL clicks. These are accompanied by monthly percent changes for the most recent month, as well as weekly trend visuals:
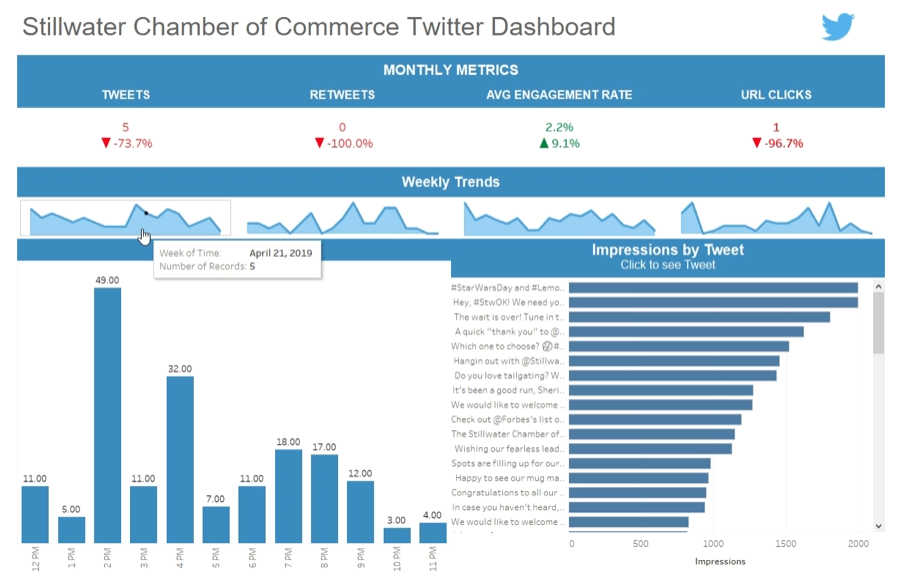
The data was exported from the Twitter data request. To add more data, the client would request the data through the Twitter Analytics page. They then select their date range and export the data. The downloaded file can be added through a union through Tableau or copy/pasted in a Microsoft Excel sheet.
The Instagram dashboard provides information and insights regarding the Stillwater Chamber Instagram page data. The dashboard contains all the Instagram page data up to the current date and provides metrics post by post, including total and monthly performance for things such as likes and comments. These are accompanied by monthly percent changes for the most recent month, as well as weekly trend visuals:
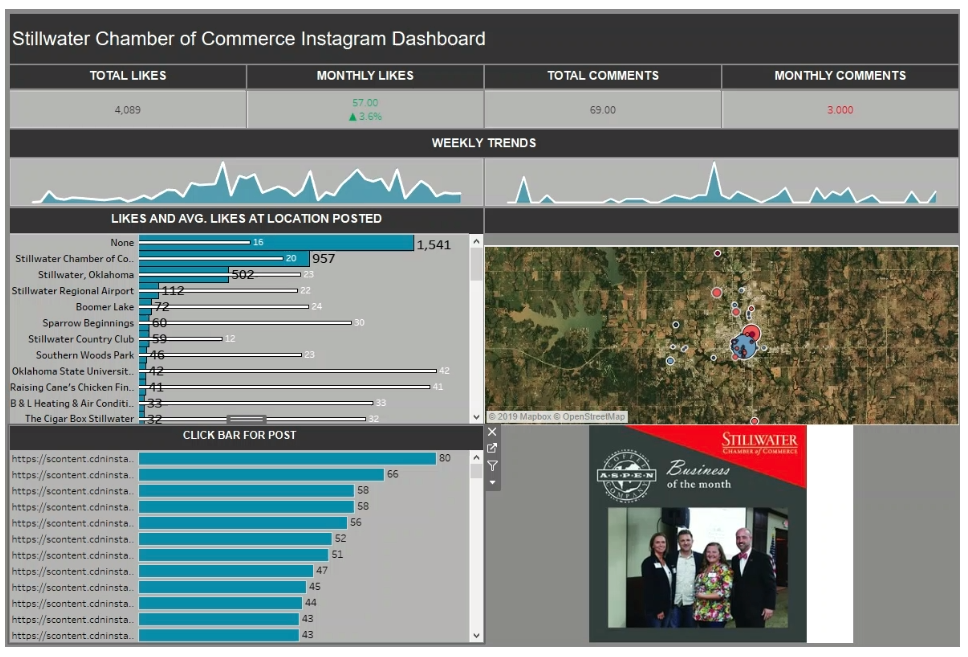
The data is connected through a web data connector that connects the client’s Instagram account to Tableau. This connector provides all the data connected to the Instagram account and updates dynamically.
Moving Forward
The best way for the Chamber to move forward could be to implement the Matillion ETL tool for Snowflake. This would help provide a more efficient way of collecting the Chamber’s data by connecting to each social media platform’s Application User Interface (API) in the Matillion environment.
Through this ETL pipeline, a workflow in Matillion would connect to the right API endpoints and store the data in Snowflake to provide the client with cloud storage space to keep the data and access it whenever they need. The goal would be for the ETL pipeline to record the data and be placed on a schedule that could update as frequently as the client needed. Moreover, the tables that are created and loaded into Snowflake could easily connect to a Tableau workbook and update the data source on its own due to the Matillion components. It is a costly solution, but it is a solution that could apply to other data solutions that the Chamber uses, such as Quickbooks and Salesforce.
Looking Back on a Summer of Work
The current solutions are dashboards that provide the Chamber a deep dive into the different areas of their organization and give them a granular look at multiple platforms. These Tableau dashboards also give the client an idea of organizational resource allocation, community standards and needs, and a look at what content they are using to impact their community. The current dashboards are easy to use, insightful and provide a good start for the Stillwater Chamber of Commerce; however, with the addition of ETL tools, this solution could really be improved and made easier to use for the client.
Spending time to learn and work with these tools and implement them into a real-world project like the Stillwater Chamber of Commerce proved to be an incredible work experience. Our team dedicated a great amount of time and effort to this project, and we were happy to deliver our best solutions to such a fantastic client.