A Parameter is any value passed to a program in order to customize the program for a particular purpose. A parameter could be anything: A string of text, a range of values, or an amount just to name a few. In Tableau, think about it like this; you need to have something for your visualization that is not exactly in your data. A parameter will allow you to provide a value to pass into Tableau. Parameters allow you to come up with scenarios or options that are not available in your data and create these values to put into your visualization. After creation, end users can control the input to see the results of the parameters effect.
Common uses for Parameters are What-If Analysis and User Input Analysis.
Four Key Things That Must Be In Place For Parameters:
1. Create the Parameter
2. Use the Parmeter in a Calculation
3. Show the Parameter Control for the User
4. Use the Calculated Field in Your Visualization
Follow the step by step instructions below:
Let’s get started by opening Tableau and connecting to the Superstore Sample Excel Data Set.
1. Drag Order Date to the Columns Shelf and Sales to the Rows Shelf.
2. Right Click the Year Pill on the Column Shelf
3. Go to More > then Custom
4. When the Custom Date box appears, Click the Month/Year option in the dropdown.
You then will have a graph that looks like this:

Step 1: Creating the Parameter
The scenario we want to create is a what-if scenario. If Sales were 3% more for example. To create a parameter, do the following;
- Go to Analysis Menu and select Create Calculated Field.
- You can also right click within the Measures pane and select Create Calculated Field from there as well
- Before we create the calculated field that will use our parameter, we have to create our parameter. So on the lower half of the dialog window there is a section titled Parameter and a link next to it that says Create. Click Create.

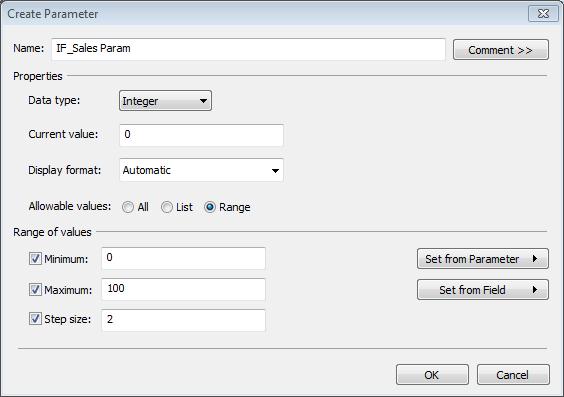
3. Fill in the dialog window exactly as above. 0 to 100 Step size of 2 on Data Type Integer. Name your Parameter IF_Sales Param
4. Click OK. Your Parameter now shows up in your Parameter box.
Step 2: Using the Parameter in a Calculation:
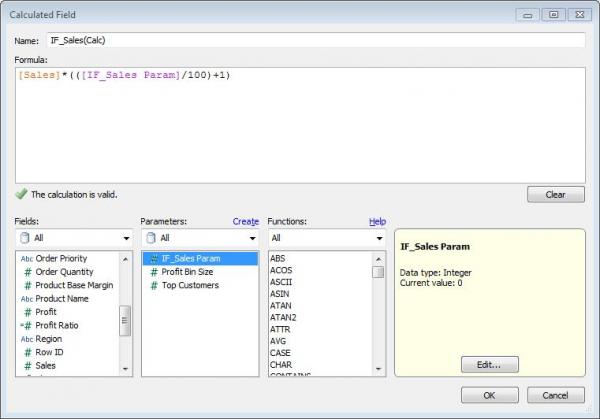
For our scenario, we now want to use the parameter to create a calculated field to add to our graph see its effect on our data. While still in the Calculated Field dialog window, create your calculated field:
1. Name your Caluclated Field IF_Sales(Calc)
2. Formula: [Sales] * (([IF_Sales Param]/100)+1)

3. Click OK
** Notice that in the calculation the parameter we created is going to interact with the Sales Measure.
Step 3: Show Parameter Control
Now back on the Tableau main view, you will see your Calculated field in the Measures pane, and the parameter in the Parameters pane of your Data Window. Right
1. Click on the Parameter IF_Sales Param
2. Select Show Parameter Control
3. Your Parameter Control Filter shows at the top right of your view

Step 4: Use Calculated Field in Your Visualization:
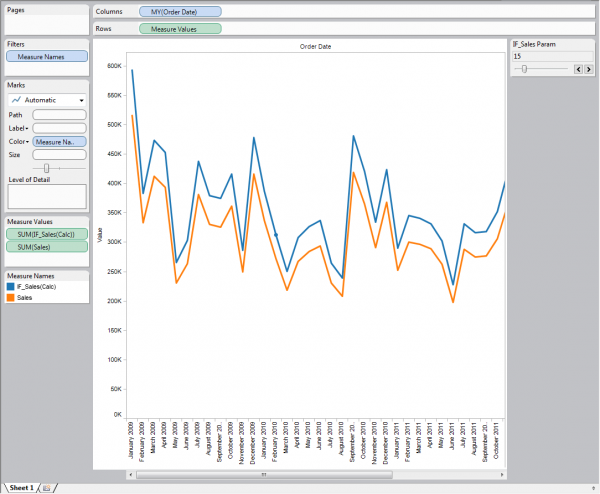
1. Drag the Calculated Field IF_Sales(Calc) and drop it on top of your Sales Axis. You will see a transparent equal sign as you hover. After dropping you will notice Measure Names has now been added to your color shelf, and a Color legend is showing both Sales and IF_Sales.
2. Because your Parameter control is at 0, your lines are on top of each other.
3. Click on your Parameter control, and you will see the two lines appear.


