Over on the forum, Jeremy asked about making trellis charts. For more info on trellis/panel charts, John Peltier has a great article about them. Consider a case where you want to visualise two measures (eg sales and time) for a Dimension with many members, such as State. There’s no pretty way to do this in Tableau by default. Because there are lots of members in the State dimension (up to 50), you’ll end up with one of four things:
- A crowded line chart
- A very wide chart
- A very tall chart
- Something using filters to show just a few states at a time.
None of the above are ideal. Instead, you can use the principles of small multiples to arrange your dimension members into a grid. The workbook below shows the results.
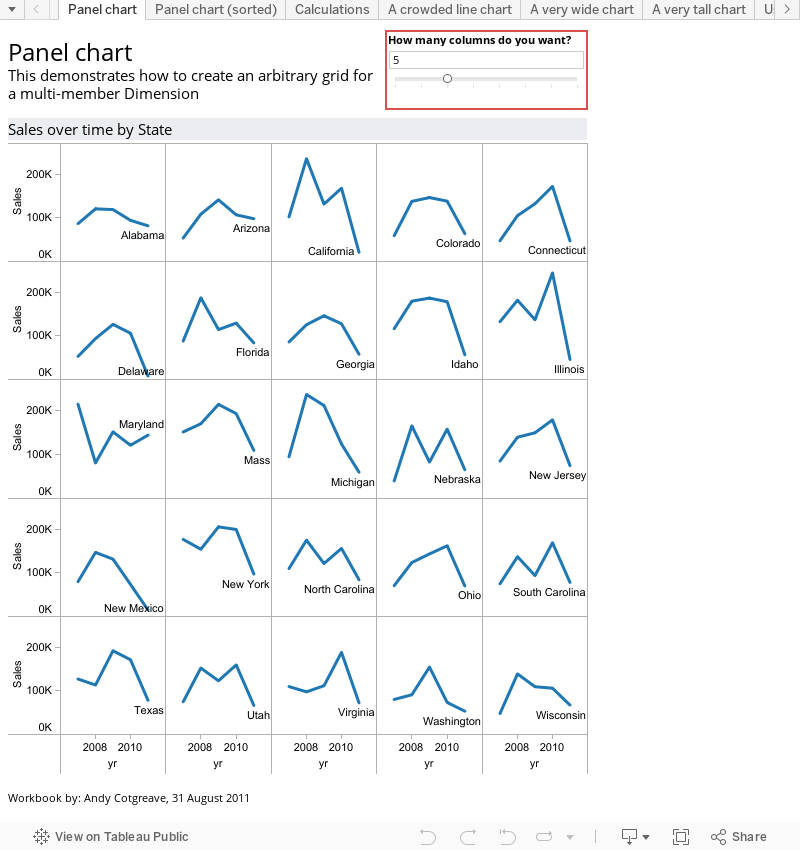
Tableau loves small multiples. I’ve blogged previously about my most satisfying creation, which used small multiples. Tableau likes small multiples that are arranged with separate dimensions on the Rows and Columns. What we’re trying to do here, though, is arrange one dimension’s members arbitrarily on a grid. The data itself contains no information that tells Tableau which row or column it should appear in. Fortunately, we can use table calculations to create that information.
1. Create an index on the Dimension that you are arranging into panels
This is nothing more than an INDEX() function, set to compute using [Customer State]. It gives each State a numerical value, rising alphabetically.
2. Create a parameter to determin the number of columns
In the view above, you can change the number of column via the Parameter slider.
3. Create a calc for the Column value
To work out the correct column for each State, the calculation uses modular arithmetic.

The calculation has to check if the modular result is zero – if it is, then that member actually needs to be in the right-most column.
4. Create a calc for the Row value
For this calculation, we don’t use modular arithmetic, but use a ceiling function based on the [index]/[columns count]. Tableau doesn’t have a native CEILING function but Alex Kerin and Joe Mako came up with some on the Forum.
That’s all we need. You can then build the worksheet as follows:
I’ve done a bit of tweaking by hiding the Row/Col value headers – they are relevant to you as the report writer, but not the viewer. I also labelled the line ends to enable identification of each panel.