
In this series, we will explore different types of calculations involving calculating distance. From a simple iteration to geographic clustering, we will take your data as far as it can go with Tableau.
The final example of using distance calculations in Tableau looks at clustering cities based on their relative distance to a selected set of points. This is based on the table calculation method we looked at in the previous two sections, with the formula I called Distance (Table Calc). Effectively, we will have three total copies of this formula, three copies of the calculated field that indicated the city we selected and three copies of the parameter that tied in our selection of a city to that calculated field.
Here is our distance calculation to copy and paste:
3959 *

ACOS

(

SIN(RADIANS(LOOKUP(AVG([lat]), First()))) * SIN(RADIANS(AVG([lat])))

+COS(RADIANS(LOOKUP(AVG([lat]), First()))) * COS(RADIANS(AVG([lat])))

* COS(RADIANS(AVG([long])) - RADIANS(LOOKUP(AVG([long]), First())))

)
3959 is half of the Earth’s diameter in miles. If you are using kilometers, this needs to be 6371 km.
Our city indicator calculation:
If [City, State]=[City parameter] then 1 else 2 end
And how we created our parameter:
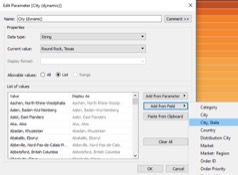
When we have three copies of these items, we can compare the distances using one calculated field. We are doing this with three cities; just realize that if you are wanting to do this with more locations, you are going to have a progressively longer calculation to write:
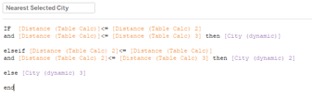
Here, we are effectively saying that if the distance attributed to our first city selection is the smallest when compared to the other two, return that city. Then, we reiterate this for our second city selection and pick up the remainders for our third city.
Setting up a Nested Table Calculation
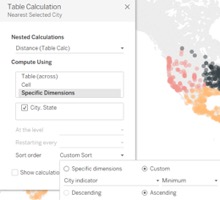
I placed this field on color. To have it run effectively, we need to set up how this table calculation runs as well. This calculation is a nested table calculation, meaning that it references multiple other table calculations. Within the table calculation editing window, we can choose how we would like to run each of these calculations that run within the Nearest Selected City field; we need them to run in the same way these table calculations have run before: on the Specific Dimension of our City, State field, sorted by the minimum of the indicator field, so they are comparing to the chosen city.
Now, when we select three different cities, we should see three colors in our view, showing us which cities are closest to our selections. If this is not working for you, double-check that you have three separate copies of the distance formula and indicator field in your Data pane, three city parameters shown with different cities selected and that the nested table calculations are running in the desired way:
Looking Back at the Distance We’ve Traveled
While Tableau does not allow us to run calculations off of the generated latitude and longitude fields, we can export them from a map view to a CSV file, Excel or Microsoft Access and use a join to bring in the usable data. From there, we can use a distance formula to calculate the distance between the following:
- A fixed point and all others, using a calculated field
- A point selected from a small parameter and all others, using a calculated field
- A point selected from an expansive parameter and all others, using a table calculation
- A point selected on the map and all others, using a set action and table calculation
- A point selected from an expansive parameter and a list of a few points, using a table calculation
- Multiple points selected from multiple expansive parameters, which can be used for distance clustering, using a nested table calculation
I hope you enjoyed the trip!