
In this series, we will explore different types of calculations involving calculating distance. From a simple iteration to geographic clustering, we will take your data as far as it can go with Tableau.
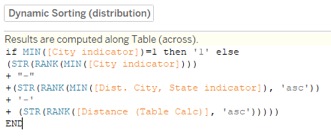
In this next scenario, we are going to look at which distribution center is closest to a selected city. This is highly similar to the previous scenario with a change to the setup for the crosstab’s filtering. We need to have a two-level sort similar to the one before, while taking into consideration 1) whether a city is selected or not and 2) a rank of the distance to all non-selected cities. This is our Dynamic Sorting field below and on the left of the crosstab image.
Filtering with Dynamic Sort
We can place the selected city at the top and then our distribution centers using either the Distribution City Indicator or City Indicator field. Next, we can filter out every other city using the Dynamic Sort Filter field in our Filters card for a nice clean table. Shown below are views of the table and the Dynamic Sort Filter calculation used to pare down our data to just the selected city and our distribution cities:
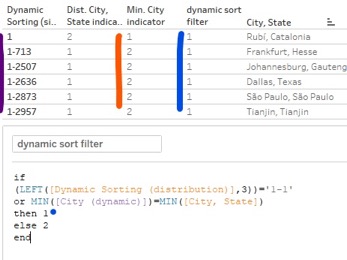
We can then sort by the City Indicator field, which will place the selected city on top, followed by our distribution centers. The distribution centers will automatically be ordered by the Dynamic Sorting field on the left after we sort, due to that being the field initially splitting out our rows.
To clean up our table (and really any table produced in a similar fashion), we can right-click the pills on our Rows or Columns that we wish to hide and uncheck Show Header.
The next blog in our series explores clustering based on distance, so be sure to stay tuned for the final installment of our Going the Distance in Tableau journey.