
In this series, we will explore different types of calculations involving calculating distance. From a simple iteration to geographic clustering, we will take your data as far as it can go with Tableau.
Let me start off here by laying out the pros and cons of using table calculations when it comes to measuring distance.
- Pros: Table calcs do all of the work instead of us having to type out every latitude and longitude coordinate in a calculated field.
- Cons: Table calculations depend on the structure of the temporary table that backs up your viz, so they are very particular about how they are computed.
- Table Calculation Tip: If you are not seeing the results you anticipate when you are working with a viz, duplicate it as a crosstab to see how Tableau is interpreting the structure of the temporary table. The order of pills in your marks card and the dimensions by which the table calculation are computed can impact how the calculation is being computed.
Here is our basic plan: We are going to be comparing a list of cities to a selected city. This selected city will be presented in the first row of our temporary table, and the distance of every other city will be computed against the latitude and longitude of the city in the first row of temporary table (which, remember, is the city we selected).
Creating the Dynamic Parameter in Tableau
We are first going to create a parameter containing all of the cities in our dataset. We can do this pretty easily by just adding a list of values from a City, State field that we have created; this City, State field ensures that we have unique geographic locations:
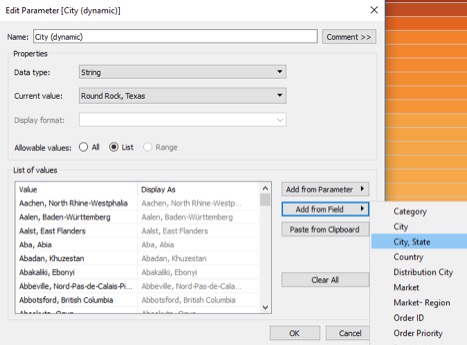
Note: We can also use the All option to select all cities in our dataset. This allows us to dynamically update our parameter field with a Data-Driven Parameter extension in our dashboard. This will come in handy if you are adding new locations to the original data source.
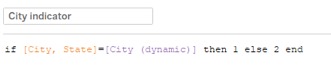
To ensure that the city selected from our parameter is actually in the first row of the table, we are going to create a calculated field to indicate whether a city is the selected and use this to sort our cities. That will look something like the calculation below. When the time comes, we will use the MIN aggregation—it is the fastest aggregation in Tableau—and sort ascending, so our city indicated with a 1 is placed above all others that have a 2 assigned to them:
Building the Distance Calculation
Now we can build out our distance calculation, similar to the previous examples. The difference here is that instead of having the longitude and latitude coming from parameter values, it is now coming from the city in the first row of our data via a LOOKUP function; this is what turns this calculated field into a table calculation:
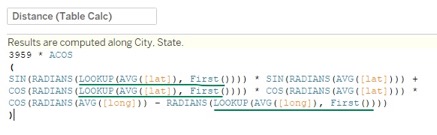
To copy and paste:
3959 * ACOS

(

SIN(RADIANS(LOOKUP(AVG([lat]), First()))) * SIN(RADIANS(AVG([lat])))

+COS(RADIANS(LOOKUP(AVG([lat]), First()))) * COS(RADIANS(AVG([lat])))

* COS(RADIANS(AVG([long])) - RADIANS(LOOKUP(AVG([long]), First())))

)
3959 is half of the Earth’s diameter in miles. If you are using kilometers, this needs to be 6371 km.
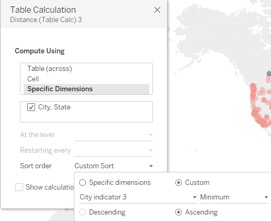
We’re almost there. We can add in our distance calculation to any view and compute it using City, State with a Custom Sort order of MIN(City indicator), Ascending. If this is not working the way we intend, we can duplicate this view as a crosstab to get an understanding of how the table calculation is running against the temporary table:
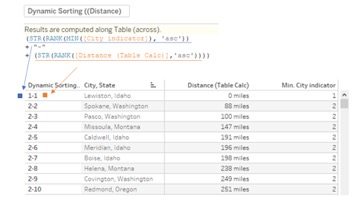
Beyond Distance Calculations: Two-Tier Sorting
If we want a crosstab view with our cities being sorted by our selected city and then all other cities with their distance from the selected city, we need to create a field incorporating both of these variables, which we can then use to sort.
We cannot simultaneously sort a dimension based on two measures, or multiple dimensions based on multiple measures, but we can create a calculation combining these into one field. We can simply bring this field to rows in front of City, State, and it will sort by the city we have chosen and then the distance. This field can also be hidden by right-clicking the pill and unchecking Show Header for a clean look:
Stay tuned for the next post in this series where we discuss taking these calculations to the next level with Tableau’s latest game-changer, set actions.