In this series, we will explore different types of calculations involving calculating distance. From a simple iteration to geographic clustering, we will take your data as far as it can go with Tableau.
Calculated fields are awesome. They can be used to discover incredible insights in your data by using fields from your original data source. And if some of those fields are latitude and longitude, they can be used for more than just plotting. You truly can use calculated fields to go the distance.
Distance Calculations in All Their Variations
In this blog series, we are going to break down several types of distance calculations in Tableau, including:
- A fixed point and all others, using a calculated field
- A point selected from a small parameter and all others, using a calculated field
- A point selected from an expansive parameter and all others, using a table calculation
- A point selected on the map and all others, using a set action and a table calculation
- A point selected from an expansive parameter and a list of a few points, using a table calculation
- Multiple points selected from multiple expansive parameters, which can be used for distance clustering, using a nested table calculation
Comparing a Fixed Point to All Others
In our first scenario, I am looking at distance from a central distribution point, which I have decided is in Oklahoma City at the crossroads of Interstate-35 and Interstate-40. I am then going to use that to look at shipping cost per mile.
Here is our calculation with OKC’s coordinates for reference:
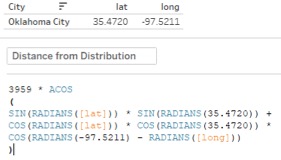
And if you want to copypasta:
3959 * ACOS

(

SIN(RADIANS([lat])) * SIN(RADIANS(35.4720)) +

COS(RADIANS([lat])) * COS(RADIANS(35.4720)) *

COS(RADIANS(-97.5211) - RADIANS([long]))

)
3959 is half of the Earth’s diameter in miles. If you are using kilometers, this needs to be 6371 km. OKC’s latitude and longitude coordinates are 35.4720, -97.5211.
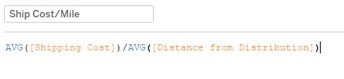
And our Shipping Cost per Mile calc:
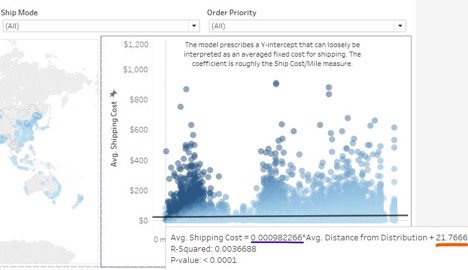
This information can be attained in a slightly different way by using a scatterplot and trend lines:
 |
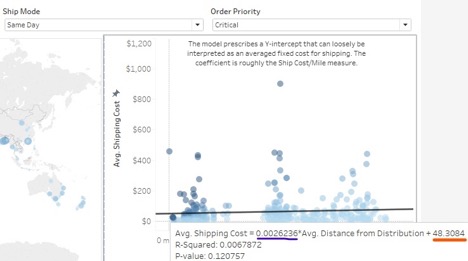 |
Y-intercept Coefficient
This model gives us additional context for our evaluation of shipping cost per mile. The Y-intercept is effectively a measure of estimated fixed cost for shipping, while the slope coefficient is the cost per mile. We can see both of these measures increase when we look at orders that had a Critical priority and were shipped the same day.
The next post in this series will be discussing comparing distance using parameters, thus affording us greater interactivity. Stay tuned.
Related

Interworks GmbH
Ratinger Straße 9
40213 Düsseldorf
Germany
Geschäftsführer: Mel Stephenson
Kontaktaufnahme: markus@interworks.eu
Telefon: +49 (0)211 5408 5301
Amtsgericht Düsseldorf HRB 79752
UstldNr: DE 313 353 072