
While in Chicago conducting a training last week a client asked me whether you can offer a hide/show option for reference lines on a published dashboard. My immediate thought was Tableau doesn’t have a native option to support this, but quickly my mind turned to how we can leverage parameters and table calculations to implement the functionality ourselves. Below is what we came up with using the Superstore Sales Excel data source shipped with Tableau Desktop Pro.
For a copy of the final solution, download the file attached to the bottom of this post.
Step 1 – Create the chart
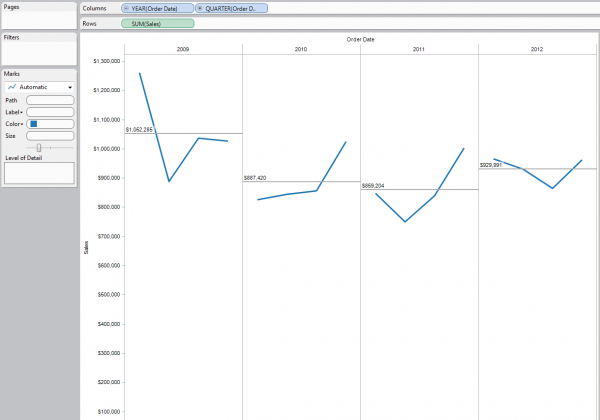
Create a simple line chart showing SUM(Sales) over discrete years and quarters of Order Date.
Step 2 – Add a reference line
Create an average sales reference line by right clicking on the SUM(Sales) axis. Choose Per Pane as the Scope, SUM(Sales) Average as the Line Value, and select Value as the Label. Click OK.
The result should be a line chart which displays an average quarterly sales reference line for each year in the view. This is the result we want to mimic in our solution while providing the option to hide/show the reference lines using a parameter.
Step 3 – Create a parameter
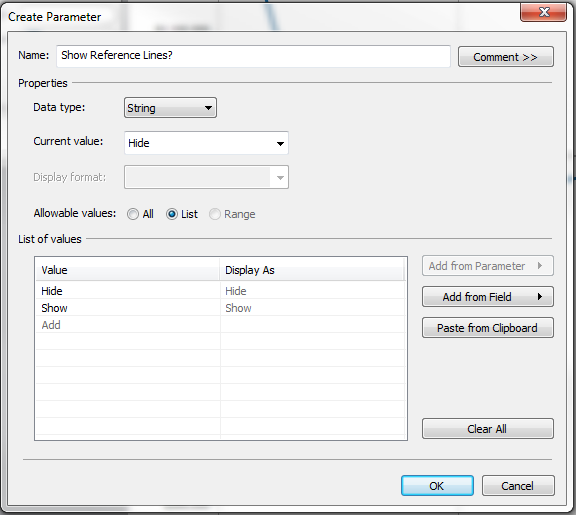
From the dimensions window, choose to create a new Parameter. Set the Data Type to String. Choose List from Allowable values and enter the following two entries: Show, Hide. Name the parameter Show Reference Lines? and click OK to finish.
Step 4 – Display the parameter
From the Parameters window right click on Show Reference Lines? and select Show Parameter Control.
At this point we have a control on our worksheet that allows users to choose hide or show reference lines but these selections won’t effect our view until we create a calculation that checks what value the user has selected and acts on it. The formula will calculate and show the average for the reference line when Show is selected and return NULL when Hide is selected, effectively removing the reference line from the view.
Step 5 – Create a calculated field
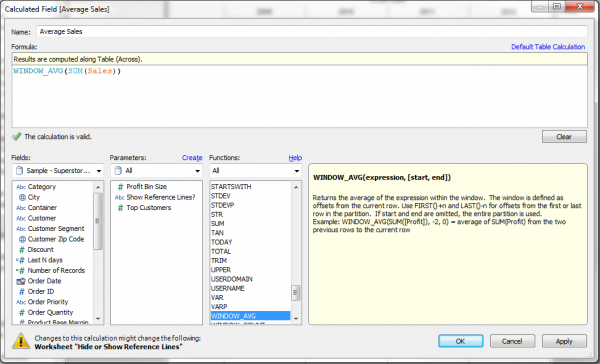
From the dimensions window, choose to create a Calculated Field. Name the field Average Sales. From the function list choose the Table Calculation group, then double click WINDOW_AVG.
At this point it’s important to note the differences between Table Calculation functions and all others supported by Tableau. Table Calculations can often be a source of confusion and frustration for anyone without significant experience working with them.
Nearly all functions within Tableau are passed directly back to the data source where they are calculated and returned as a value to Tableau. That is, all functions except Table Calculations. Table Calculations are performed in memory by Tableau against the data that has already been returned from the data source. For that reason, they can only accept fields and expressions already found in our view.
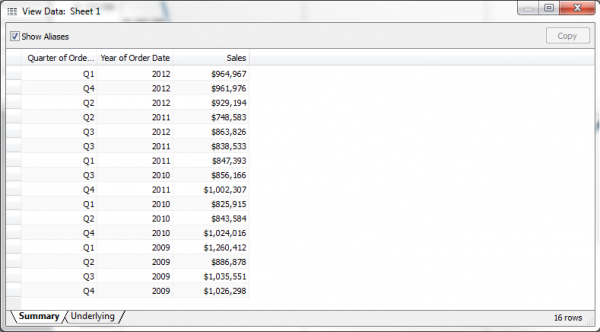
In our example, we can select all the marks in our view and choose to view the summarized underlying data by right clicking and selecting View Data. The default Summary tab shows three columns of data: Quarter of Order Date, Year of Order Date, and SUM(Sales). This data is the result returned from the data source to Tableau and can be thought of as the table of data Tableau has available to it to perform Table Calculations.
Inside the WINDOW_AVG function, add SUM(Sales). Your entire calculation should now read WINDOW_AVG(SUM(Sales)). Recall, SUM(Sales) was one of the fields available to us in our view. The WINDOW_AVG function will take the average of those values based on our set scope and direction (next step). Click OK to complete our calculation.
Step 6 – Add the calcualted field to the Level of Detail
Drag and drop the Average Sales calculation into the Level of Detail shelf. This will make the calculation available for the reference line. Change the scope and direction of the table calculation by right clicking on Average Sales and selecting Compute Using -> Pane (Across). This ensures that the calculation will reset for each year, giving an average for each year instead of an average across all years.
Step 7 – Update the reference line to use the calculated field
Update the current reference line to use the calculation through a right click on the SUM(Sales) axis and selecting Edit Reference Line. From the Value drop down choose Average Sales. Click OK to finish.

Notice the values did not change, only the formatting. We can update the formatting options for the calculation by a right click on the Average Sales field under Measures and choosing Field Properties -> Number Format.
Step 8 – Update the calculated field to hide/show the value based on the parameter
The last and final step is to update the Average Sales calculation so that it checks the selected value of our parameter from Step 3 and displays a result only if Show is selected. Right click Average Sales and choose Edit to modify the calculation to the following: IIF([Show Reference Lines?] = “Show”, WINDOW_AVG(SUM(Sales)), NULL). The IIF function accepts up to 4 arguments. The first is a conditional test, the second is the value to display if the test is true, the third is the value to display if the test is false, and the fourth is optional and will display if the test is NULL. Click OK to finish.
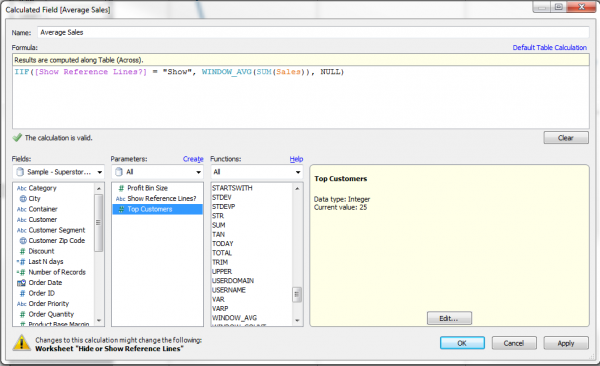
The result is a calculation which returns NULL when our parameter is set to Hide, effectively hiding the reference lines in the view.
I hope you found this entry useful. It’s a great example of tying together two advanced techniques – table calculations and parameters – to customize a view to fit the exact behavior you’re looking for. Below is a video demonstration of this technique, created by InterWorks’ Dan Murray.