Exploring D.C. Metro Delay Data in Tableau

Data

Exploring D.C. Metro Delay Data in Tableau

Washington, D.C.’s Metrorail, opened in 1976, covers 110 miles of subway track, 6 metro lines and 91 stations. System upgrades have been long overdue, with considerable malfunctions and delays surfacing at greater frequencies over the past few years. From a train fire that killed a passenger to operators abandoning their trains once their shifts are over, the Metro has a considerable amount of work to do in improving the safety, infrastructure, and performance of the rail system. 

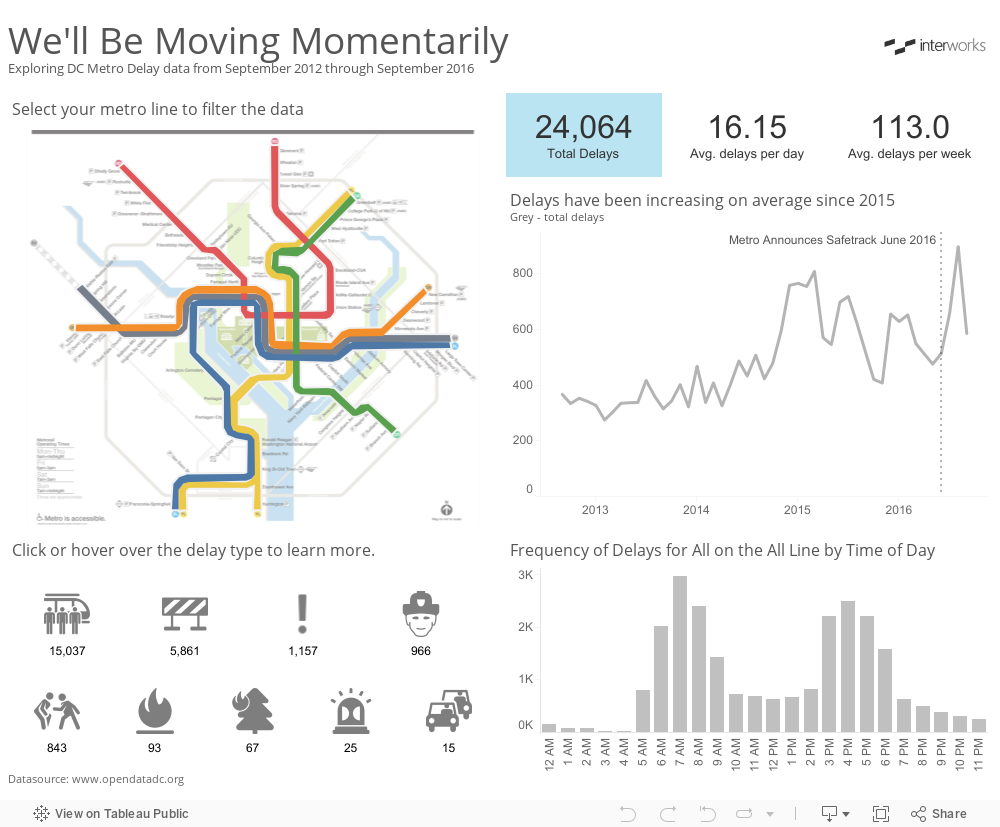
As of May 2016, Metro launched its SafeTrack program – a $5 billion program intended to perform the upgrades that are so badly needed. I decided to explore the types and frequencies of delays on the Metro over the past few years and visualized the data in Tableau. Enjoy!

More About the Author

Debbie Yu

Services Director, Americas
Skills for Conflict Resolution in Consulting At InterWorks, we pride ourselves on making genuine connections with our clients and delivering excellent value and service at the same ...
Soft Skills for Consultants If you google, “skills every consultant should have,” you’ll get pages and pages of articles online listing out key skills for ...

See more from this author →

InterWorks uses cookies to allow us to better understand how the site is used. By continuing to use this site, you consent to this policy. Review Policy OK

×

Interworks GmbH
Ratinger Straße 9
40213 Düsseldorf
Germany
Geschäftsführer: Mel Stephenson

Kontaktaufnahme: markus@interworks.eu
Telefon: +49 (0)211 5408 5301

Amtsgericht Düsseldorf HRB 79752
UstldNr: DE 313 353 072

×

Love our blog? You should see our emails. Sign up for our newsletter!