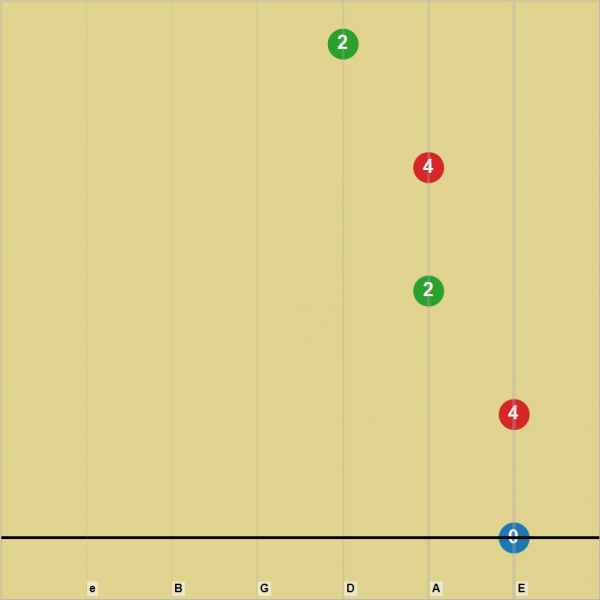
Creating visualizations in Tableau that are out of the ordinary are always fun. If you visit the Visual Gallery at Tableau’s website you can see great examples of this. My personal favorite is “An Analysis with Teeth” Like the analysis with teeth, I leveraged the Pages feature in Tableau to build a visualization that you can teach yourself guitar with. I constantly used to play guitar video games, and when you put the visualization into motion, it resembles a video game, but you are now actually learning to play the guitar with actual songs. This visualization is the first song I learned on the guitar, the Boogie Woogie.
Here’s a pic of how the view looks:

When put into motion, as the numbered dots hit the black line, they indicate which finger and fret to play and on which string. For beginners, use the slow play option on the pages shelf. For intermediate, use the medium playback speed. You can now teach yourself songs on the guitar, and without the clutter of sheet music.
This is meant to be used in Tableau Desktop for the automatic motion and speed options.
To download go to: http://public.tableausoftware.com/views/TeachYourselfGuitarwithTableau/BoogieWoogie

