Dashboard space is highly valuable, and there are many suggestions out there as to what is a best practice when creating. One thing that most everyone agrees on is that too much clutter is just confusing to the end user. It makes the dashboard harder to understand and more difficult to work with.
When using Tableau to create your dashboard, it has the ability to hide views from view on your dashboard that will only appear when your trigger them. Using a combination of layout containers and dashboard actions will allow you to leverage this ability.
Below are the basic steps to make this work. Follow the steps and you can do the same thing:
1) Open Tableau and Connect to the Superstore Sales – Excel data set.
2) We want to create 2 views.
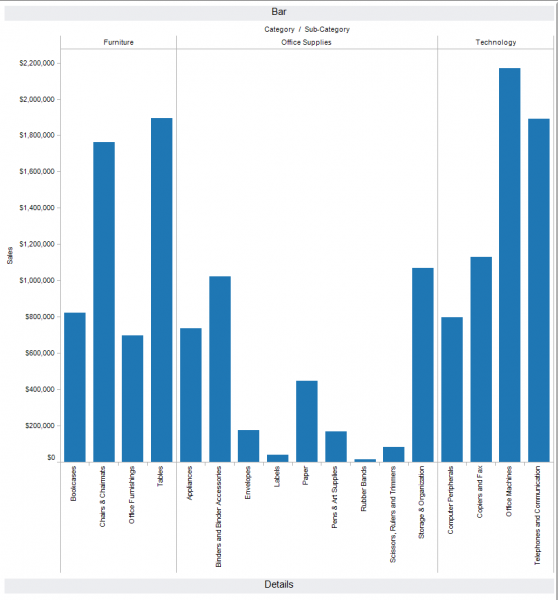
a. The first view is a Bar graph of Sales by Category and Sub-Category

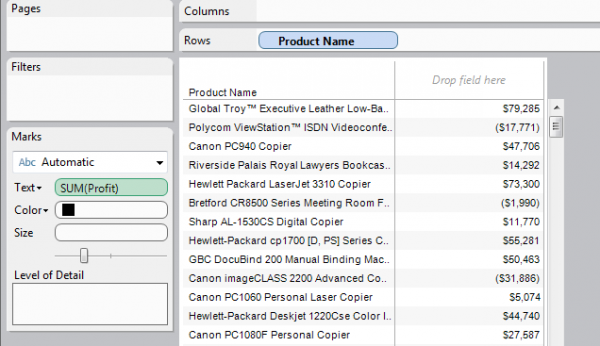
b. The second is a Detail Text Table of Product Name with Profit.
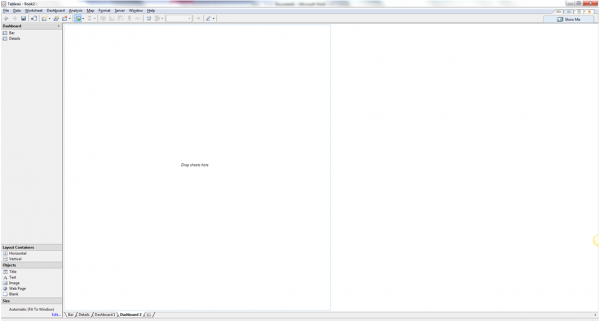
3) Create a new Dashboard.
4) From the Layout Containers Menu on the lower left, Drag a Horizontal Layout Container Onto the Dashboard.
5) Now for space reasons, from the Objects Menu on the lower left, drag a Blank to the right side of the Dashboard so you have a dashboard that has the appearance of two columns. **Step 5 is totally optional. It just makes things look right in the end.
6) Drag the Bar Graph into the Layout Container. Make sure view is set to Entire view on the toolbar.
7) Drag the Details into the Layout Container as well and drop below the Bar Graph. I’ve selected Fit Width here.
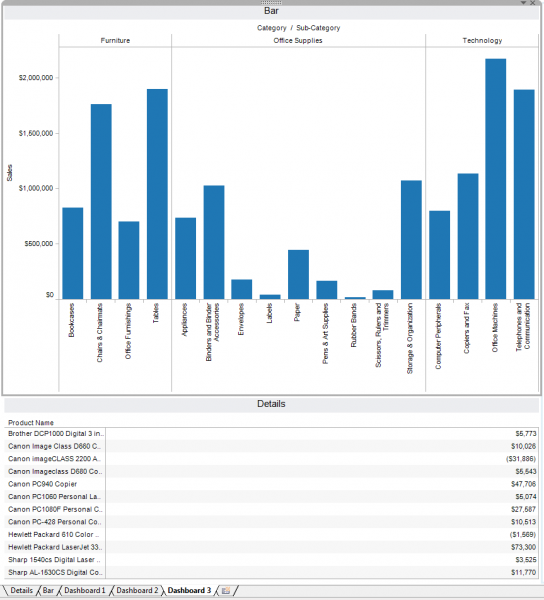
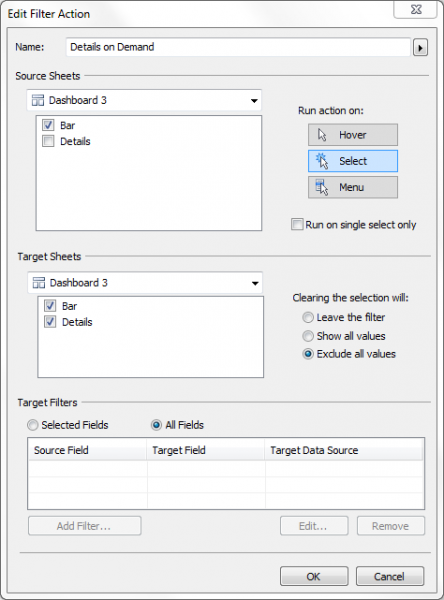
8) Create a Dashboard Action with the Source Sheet being your Bar Graph and the Target Sheet being your Details. Run the Action on Select, and Exclude Values when Clearing the Filter.
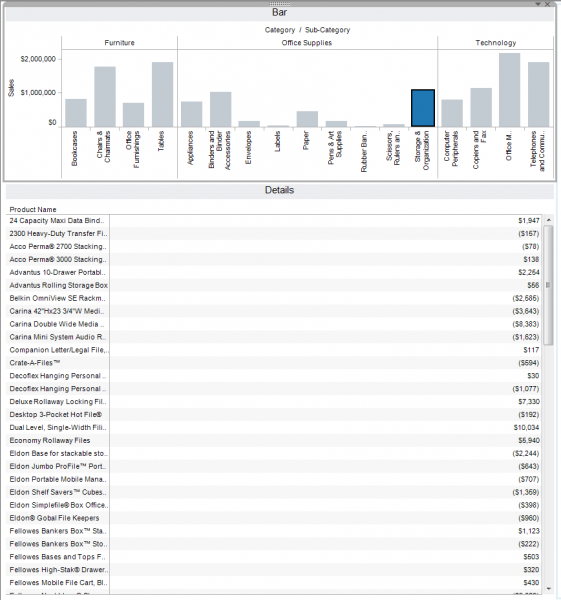
9) Test your filter by clicking on one of the bar graphs in your views. Your Details view should change.
10) Now Clear your filter by hitting Esc or double clicking in white space, and your Detail view should minimize to the bottom of the container.
