
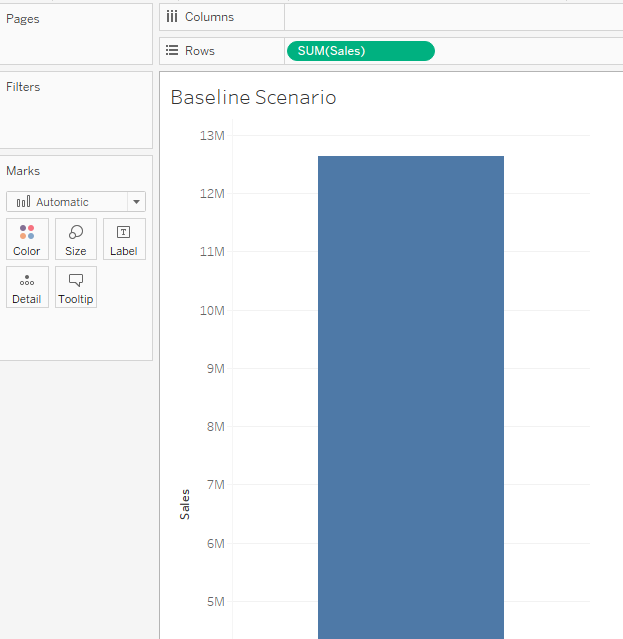
I often find myself building dashboards with a parameter to compare baseline data to different scenarios. Because these scenarios are built out in different worksheets, I am faced with the challenge of correctly displaying changes in results compared to each other. In the mocked-up example below, you can see how the axes change dynamically within each worksheet, yet the bars stay the same height, making it difficult to quickly see the difference.
Note: This example uses Global Superstore training data.
If you hunt through the Tableau forums, you’ll find that the ability to synchronize axes across worksheets is not built into the software. The official suggestion from Tableau is to manually fix the axis height to the same value across all worksheets.
This works, except it is not very future-proof if the data ever changes or updates … and when do we ever work with purely static data? Thanks to my colleague Carl Slifer, we have a better solution—and you will love the simplicity of it.
Step-by-Step Guide to Synchronizing Axes in Tableau
Step 1: Create the first worksheet with your baseline data (I simply use total sales):
Step 2: Create a worksheet to represent your scenario. Here, I use a simple parameter to change sales +/- a factor of 10%:
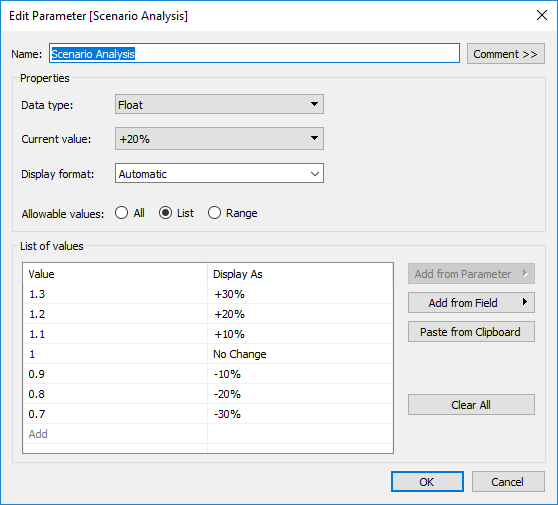
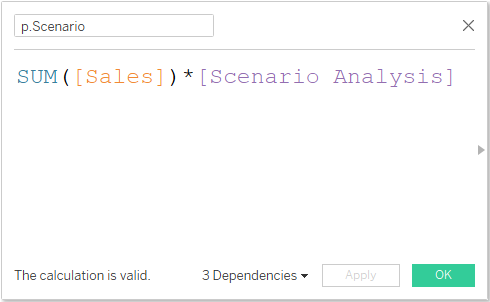
Hint: Once the parameter and calculated field are created, show the parameter and drag the calculated field to the Rows shelf to create a mirror image of the sales.
Step 3: Now, here comes the cool part. We need to add a reference line to each worksheet. We also need the reference line to be calculated by whichever value is larger: sales or the scenario-adjusted sales. We do this by creating a calculated field with a simple formula using MAX. The use of MAX is important because we want to stretch the axis of other worksheets relative to the value of the largest value being compared:
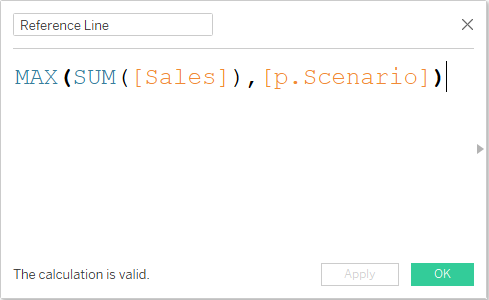
This will re-position the reference line based on which value is largest between the two worksheets.
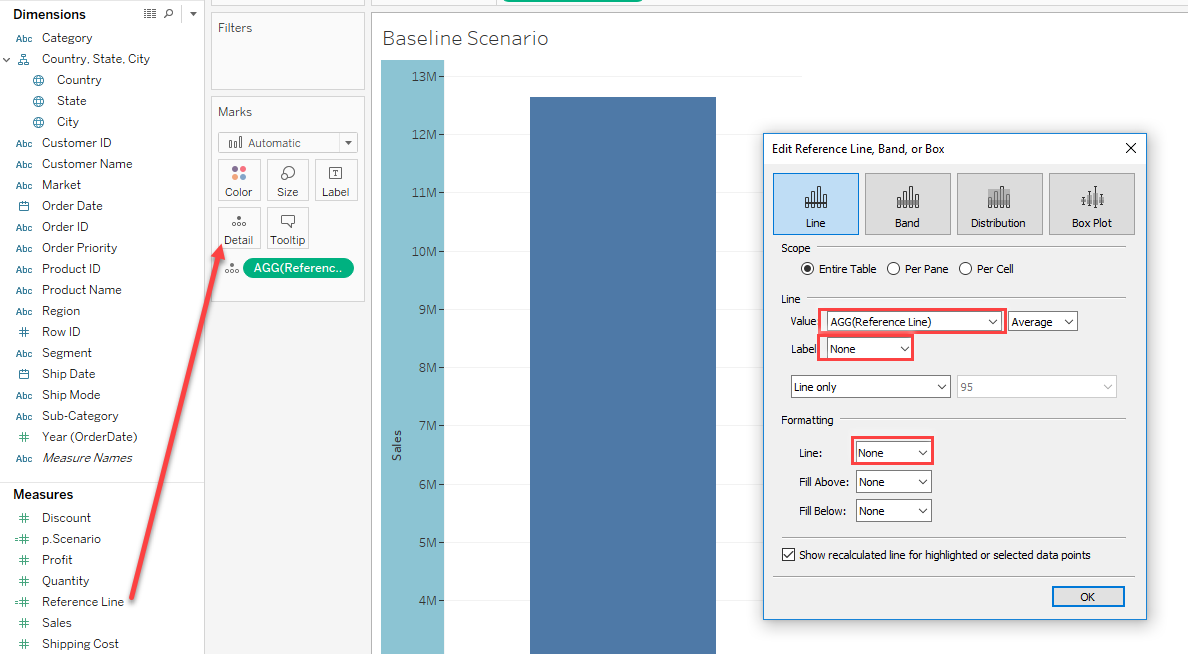
Step 4: Place the Reference Line calculated field on the Details tile of the Marks card for each worksheet. Next, format the reference line so it does not show a value or line:
Step 5: Lastly, build out your dashboard, adjust the parameter control, and be dazzled as your bar graphs re-size relative to each other!
The last piece to keep in mind is to ensure you align your graphs appropriately on the dashboard. Consider putting both graphs in a container and checking that axis font sizes, titles, etc. are the same for each worksheet as these formatting pieces could also skew how the graphs visually align:

Synchronize Axes with a MIN Function
BONUS! Have negative values in your data? You can set up your axis to display negative values as well. Starting at Step 3, use the MIN function instead, and add a second reference line to your graphs based on the minimum value. This will give your graphs two reference lines that will respond dynamically to your data.