
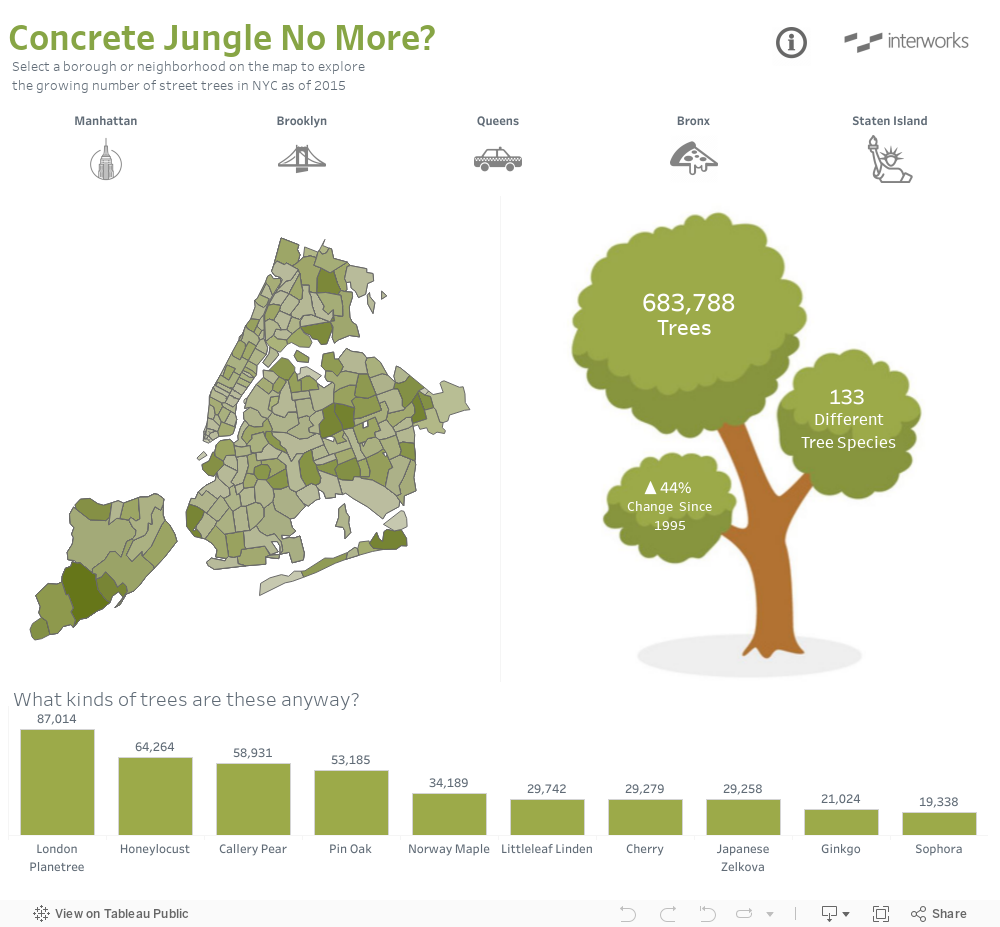
In 2015, volunteers from all over New York City came together to engage in the biggest participatory urban forestry project in United States history. Over 2,200 people walked more than 11,000 miles to collect data for every tree that lines the streets of the five boroughs of NYC. This helped create massive and publicly-available data that has helped start a dialogue about whether a city nicknamed “The Concrete Jungle” needs to be updated for the 21st century.
Cleaning the Data
While the most comprehensive data was compiled in 2015, this is actually the third census that has been undertaken. The first, which took place 20 years prior in 1995, helps to tell a story of the evolving nature of the foliage in the country’s biggest metropolis. To bring in all the data sets necessary to tell a story without crashing my computer, I used Alteryx to help clean the data but also to transform it into a way that was much easier to manipulate. The following steps helped me turn three massive data sets into two small files that would not bog down my system or anyone who may be viewing this dashboard in the future.
- Bring in the 2015 data, but limit the data to only the columns necessary for my analysis.
- Combine the 1995, 2005 and 2015 data, but instead of keeping the 1.7 million rows of data at a tree level, aggregate based on specified dimensions to shorten the data considerably.
- Create Tableau Data Extracts (TDE) for the two separate files to help with potential performance issues.
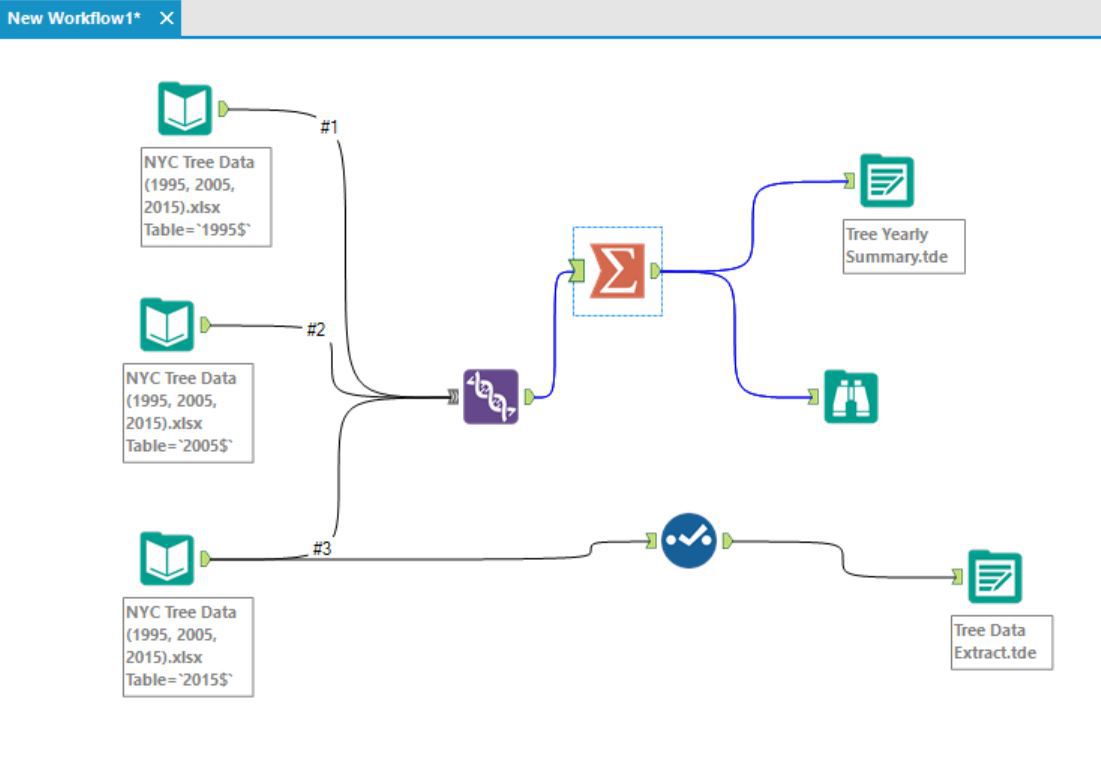
Tableau Work
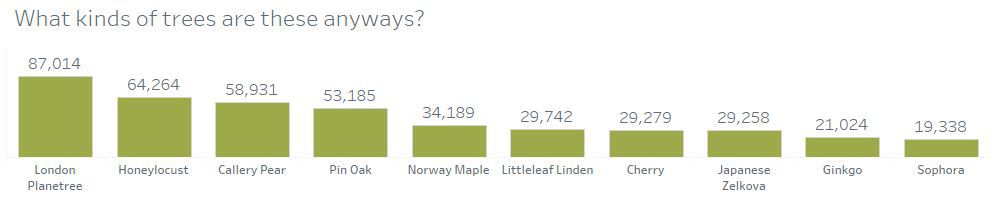
Once the data was cleaned and in Tableau, I was able to start visualizing the data. However, before I could accurately show the state of NYC’s street forestry, I needed to account for some difference in naming conventions over the years. For example, when it comes to tree species, some volunteers would classify a tree as a “London Planetree,” while others might list it as “Planetree, London.” Because of this, I created a custom group to accurately and uniformly reflect a tree’s species.
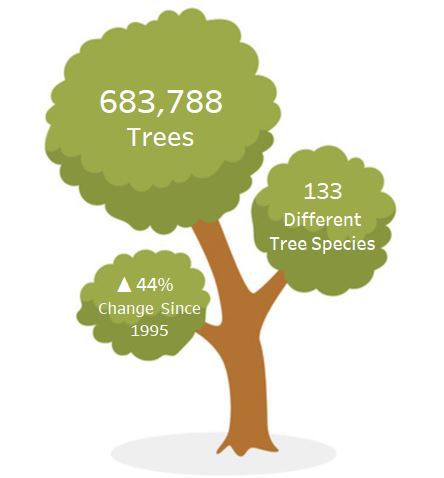
Using my aggregated extract, calculations for the number of tree types, tree totals, tree health and more were easily created. I created a calculation to show the difference between the 2015 data and the first census data from 1995, to incorporate the changes over time.
Mapping the Trees
Working with a dataset that had this level of detail, I wanted to incorporate a way to see information on each tree, down to the street level. At the same time, having two maps on one dashboard can be overwhelming for a person to see for the first time. So, I used an action within a layout container in Tableau to only show a street-level map of the disaggregated trees when a user clicks on a neighborhood within a borough.
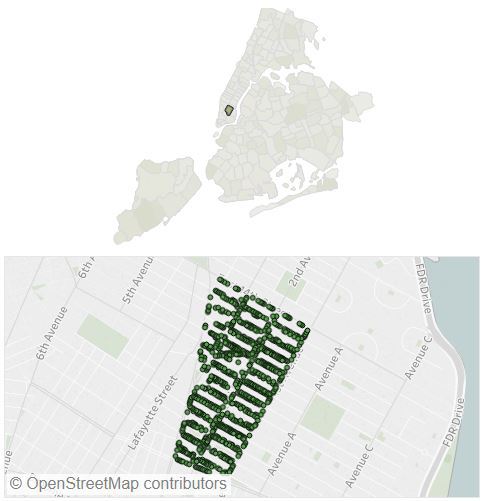
From there, specifics for individual trees can be seen by hovering over the tree-level map, and when clicked on, a hyperlink option becomes available to see the street view for that particular tree.
Tree Types, Again
If you’re anything like me, tree species knowledge is not something that comes naturally. Because of this, seeing the scientific names of the trees that dot the landscape was a fascinating way to create associations with the types of trees I see on a daily basis. Displaying it as a green bar chart on the bottom of the dashboard helped as well, so that it has the vague of appearance of grass.
Change doesn’t occur overnight and, in just 20 short years, the number of trees lining the streets of NYC has grown by 44%! That’s an astounding number when you consider the city’s population density. While urban projects can be long-lasting, hopefully exploring the data in this visualization can, at the very least, make you appreciate the growth NYC has seen in going green. Perhaps it will make you think twice the next time you’re walking down the street past the trees you see on a daily basis.