
In one of most recent projects I was asked to show a running sum of a measure over all of time. However they only wanted to see a particular window in time of this running sum that was calculated since the start of time.
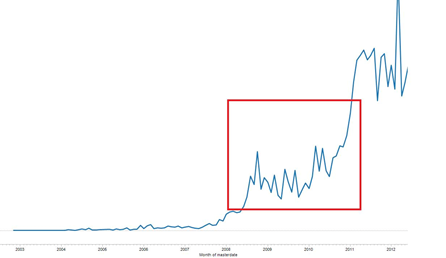
This was a problem because if you try to filter the data set down to your window then the running sum is computed from the start of that window, and no longer from the beginning of time. You could zoom to your appropriate window, but in my case the customer wanted that window to be dynamic for the user so that wasn’t an appropriate solution.
Here’s an example of how we worked around this issue. We are using the Sample – Coffee Chain access database that comes with Tableau.
First create your running sum dashboard. In this example we are going to use our [Date] field as our dimension, and [Profit] as our Measure.
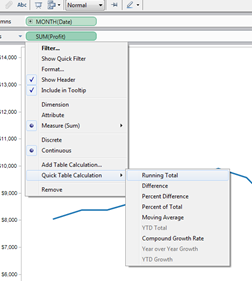
In case you didn’t already know, right click on your measure and go to Quick Table Calculation -> Running Total to get your first running total.
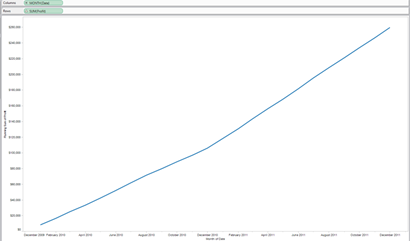
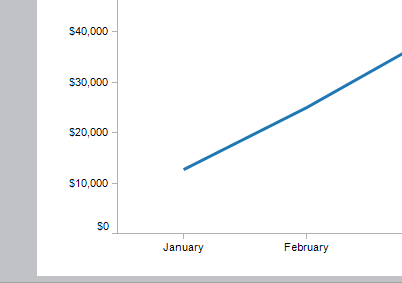
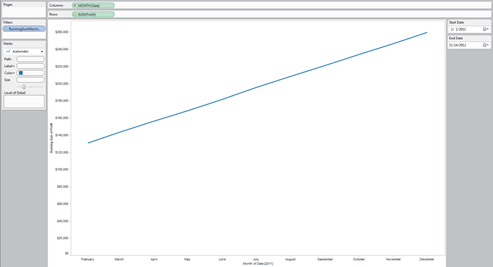
Now in the picture below you can that if we try to filter the data say to only 2011, we see that the running sum starts from 0 and grows from there which is not what we want in this case
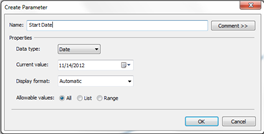
Next, create two date parameters. One you can call ‘Start Date’ and the other ‘End Date’. We will be using these parameters to define the window that we want to display later.
We also want to create a custom date off of our date field based on how we are displaying in on our dashboard.
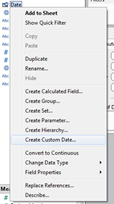
In this example since I am showing the date field monthly, I would create a monthly custom date field.
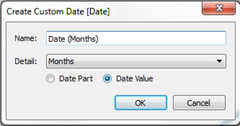
We need to do this because later we need to be able to explicitly reference the date layout that tableau is using on the viz.
Now here is where it gets tricky. If you filter your window on the database level Tableau it will start the running sum from 0 on your viz because you have filtered out those prior values. What we really want to do is filter our viz from displaying the entire timeframe, but not filter any of the database values.
To achieve this we create a calculated field that looks like this:
The code:
lookup(attr([Date (Months)]), 0) > [Start Date]
and
lookup(attr([Date (Months)]), 0)
The purpose of the lookup is to tell tableau that we aren’t necessarily interested in the data itself, we’re just interested in its position on the screen. It’s basically making sure that each point displayed is between our two parameter values.
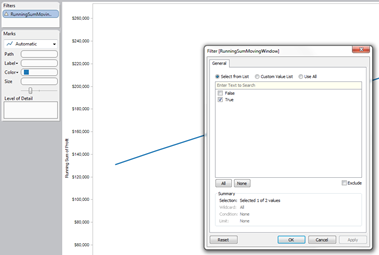
This is a Boolean statement though, as it can either be ‘True’ or ‘False’ that a particular point falls between our two parameters. We want to make sure to filter this field to always be ‘True’.
And there you go!
You should now be able to change the window you are viewing using the two parameters, all the while your running sum values start from the beginning of time.
I’ve attached the sample workbook below for download if you want to take a look.