
In the first post of this series, we reviewed how you can calculate compound annual growth rates in Tableau. This week, we’ll look at time series data using Bollinger Bands. A technical stock analyst named John Bollinger developed the technique and trademarked the name. Bollinger bands simply plot the moving average of a stock’s closing price. Typically the moving average is based on 20 days of historical data and two standard deviations from the closing price of stock or index of interest.
There isn’t really anything special about this technique. If you understand how to compute moving average and standard deviation, you can make a Bollinger Band. Here’s a finished time series chart that analyzes the S&P500 Index:
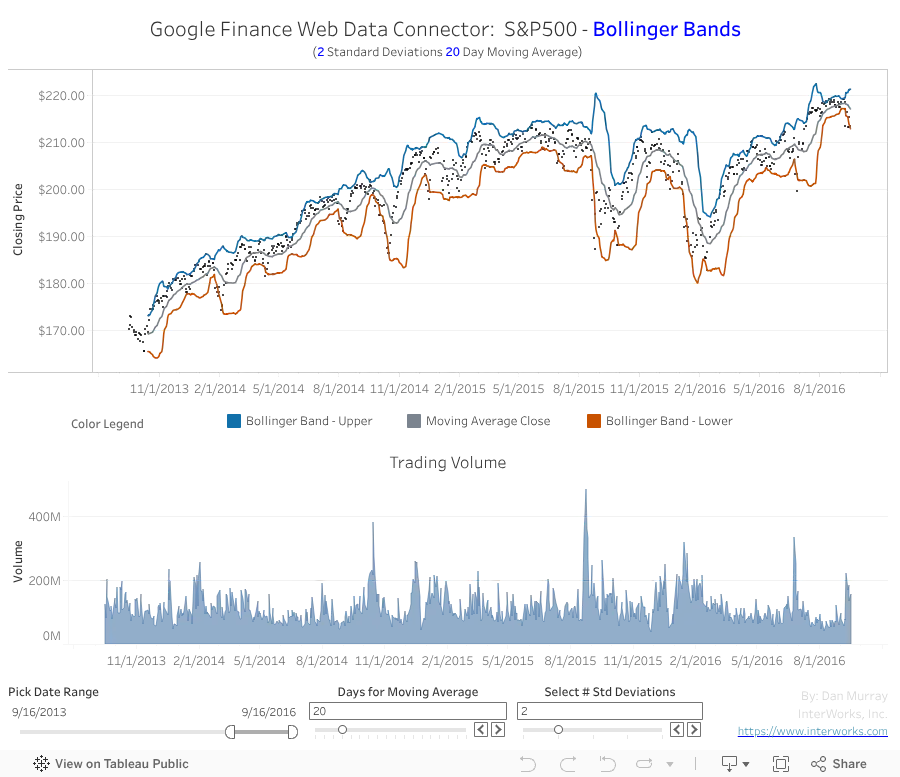
This dashboard utilizes a web data connector (WDC) to pull data from Google. You can find a variety of web data connectors on our WDC POC website. I used the stock price history web data connector to pull the daily closing prices going back to 2001. You can use this connector to analyze a wide variety of stocks simply by editing the connection, entering a different stock or index and updating the data source. The dashboard information will change to reflect the new data source selected.
The chart at the bottom of the dashboard shows the daily trading volume. It’s a simple time series using an Area mark type. The time series at the top plots four different metrics on the selected stock:
- Daily closing price
- Moving average closing price (using a table calculation)
- Upper Bollinger Bands
- Lower Bollinger Bands
Create the time series by first plotting the Close values using a continuous day date. I decided to parameterize the number of days used to compute the moving average and provided another parameter to allow you to change the number of standard deviations used for computing the Bollinger Bands. Normally, I use 20 days and two standard deviations for building Bollinger Bands.
The Parameter Controls
Here’s how I define the parameter controls:
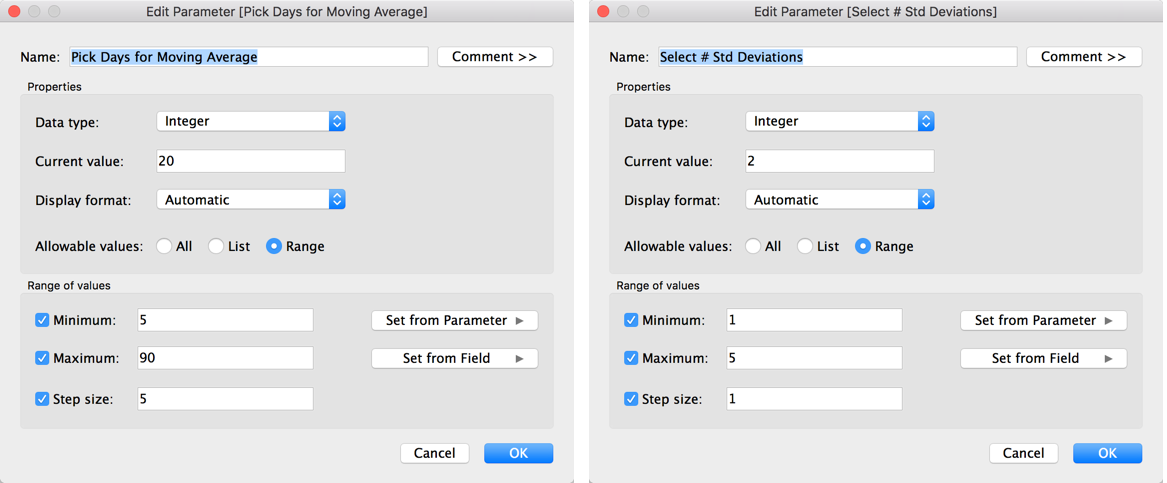
The parameter control on the left will be used to determine how many days will be used in the table calculation for computing the moving average. The parameter control shown on the right allows you to change the number of standard deviations used to compute the Bollinger Bands.
If you don’t use parameters often, there are a few steps you follow to enable them:
- Create the parameter control
- Expose the parameter on the desktop
- Use the parameter in a calculated value
- Use the calculated value in #3 in your view
To expose the parameter control, point at it in the bottom of the Data pane, right-click and then select the Show Parameter Control option in the menu.
Make the Moving Average
To create the moving average line, right-click on the AVG(Close) field pill on the Row shelf and select Create table calculation. Just select the moving average option and pick 20 days.
Once you’ve done that, the line will now be plotting a 20-day moving average of the closing price. Drag the close field from the Data pane into the Row shelf again to plot the average daily close amount, then make a dual axis chart with the left axis plotting the AVG(Close) value and the right axis plotting the moving average. Change the mark type of the AVG(Close) plot to a Shape (filled circle).
You should now have circles being plotted from the left axis that shows the average daily closing price. From the right axis, you will have a line that is plotting the 20-day moving average. I suggest you control-drag the table calculation pill for the moving average to the Measures shelf and name the field Moving Average Close.
Next, edit the Moving Average Close calculated value—replacing the 20 with the parameter Pick Days for Moving Average.
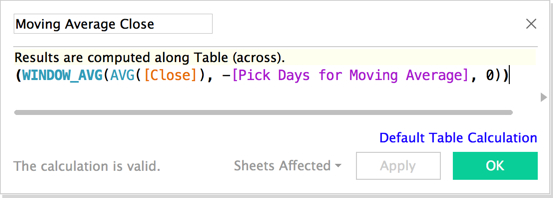
The parameter should now be operating that controls the number of days to use for the moving average calculation.
Creating the Bollinger Bands
Next create the Bollinger Band – Lower field by making a calculated value that looks like the image below:
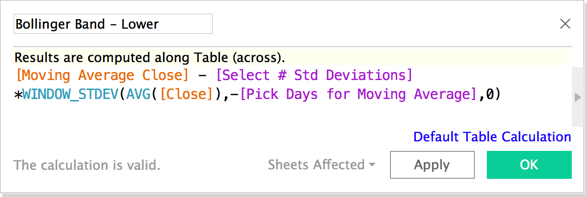
The formula utilizes the moving average calculated earlier along with the parameter controls that enable you to change the number of standard deviations plotted from the average closing price and the number of days to use for the moving average calculation. Once you have the lower Bollinger Band created, duplicate the field and edit it to create the upper Bollinger Band by adding the standard deviation to the moving average instead of deducting it, then add both of the fields to the right axis with the Moving Average Close field. Edit the color of the lines and the circle marks to your taste.
The Dashboard
After finishing the Stock Trend time-series worksheet, I edited the title of the quick filter and the parameter controls to be more descriptive then set the Pick Date Range filter to apply it to all worksheets using this data source.
Conclusion
I decided to stylize my tooltips after placing the Bollinger Band trading volume charts into a dashboard. I also created a highlight action that you can view by looking at the menu for dashboard/actions. This action highlights the chart marks by selecting marks in either chart. Bollinger Bands may help you determine when to buy or sell a particular stock, index mutual fund or ETF. Next week, I’ll take a look at candlestick charts.