Google Analytics is a great tool for keeping track of website traffic to see the effectiveness of your online marketing campaigns. However, Google’s built-in tools aren’t always the best for visualizing and analyzing the data that it collects. Therefore, it is best to extract that data and load it into Tableau to get the most worth out of Google Analytics’ website data.
Thanks to Google’s Analytics Core Reporting API, you can get access to that data directly. I found a great program put out by Keplar, called “Google-Analytics-export-to-CSV” which does exactly that, (you can download it here). It does require Java Runtime Environment, so make sure you have it installed before you try to use it.
The program comes zipped together, so extract the files to the directory of your choice. Once in that directory, you’ll notice that it comes with a readme as well as a PDF file explaining how to use the program (which I thought was rather well done) Also, you’ll see two folders: recipes and output. Recipes contains .xml files that lay down all the necessary information for the data pull-down (login information and the metrics/dimensions you want) These are predefined templates designed by Keplar; you can adjust them to suit your own needs. Or you can use the file called “query template” which leaves all the fields blank. Here’s the visitors-by-page.xml file (open this in the text editor of your choice):
If you read through each of these tags, you’ll see some that stand out:
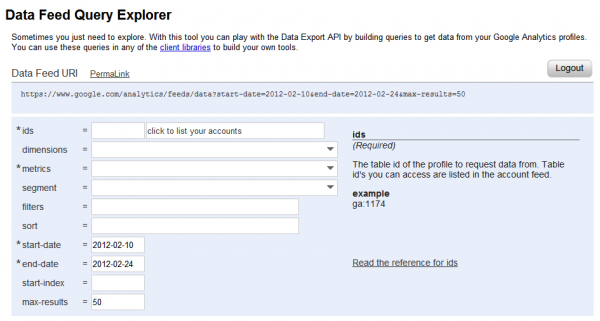
-tableId: this is the Google Analytics number given to each of the sites that you have tied to your account. The best way to obtain that information is to use Google’s Data Feed Query Explorer. The first field, ids, is where you’ll find what goes in this field.

Pick whichever website you want to analyze and type in that code between those tags.
dimensions: these are the qualities by which you’ll filter your data
metrics: these are your measures with which you can perform calculations
You can see a list of all dimensions and metrics GA has to offer here.
start-date and end-date: naturally, these are the boundaries over which you’ll pull your data. Note that both are in year-month-day (YMD) format.
userName: put in the account name associated with your GA account
password: naturally, your password for your GA account
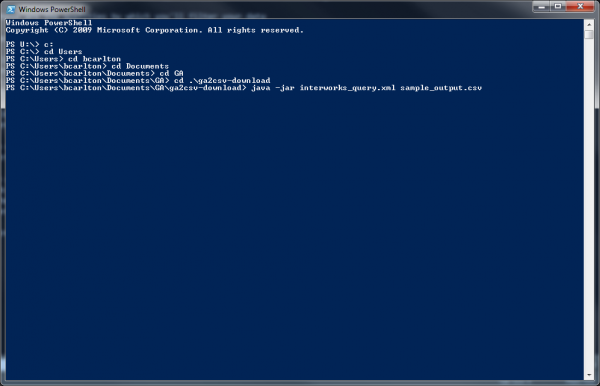
When you’ve put in all the fields, you are ready to run the program itself. The actual java program is the file called ga2csv.0.1.jar (.jar stands for JAVA archive) The program is designed to run on a command line, so we’ll be using PowerShell for that. You can access PowerShell by typing powershell.exe in the run window (for a great PowerShell cmd line primer, check this site out)
Navigate to the directory where you downloaded the program. It might resemble something like this:

Now, to actually run the JAVA program, you will enter a command that fits this form:
java -jar ga2csv.0.1.jar [yourqueryname.xml] [youroutputname.csv]
Obviously, you’ll replace yourqueryname.xml with the actual name of your query; the same goes for youroutputname.csv. You can also put in a location relative to the program’s directory as well. Here’s a more specific example:
java -jar ga2csv.0.1.jar recipes/visitors-by-page.xml output/visitors-by-page-output.csv
Assuming you’ve configured visitors-by-page.xml correctly, this will pull all the data down into a .csv located in the output directory. Now you have a .csv that you can pull into Tableau and do some serious data analysis.
***Two important caveats***
1) If you rerun this, you’ll have to delete the preexisting .csv or pick a new name because the program cannot overwrite the preexisting file.
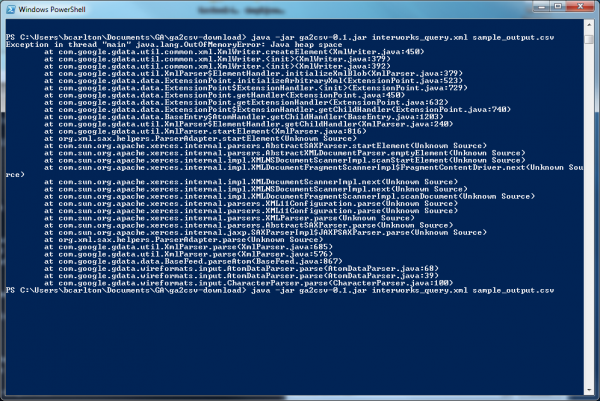
2) You may find yourself with a screen that looks not unlike this:

This is due to a heap error; the program is trying to pull so much data down that it doesn’t have the memory to handle it and crashes based on its current configuration. To get around this problem, increase the max heap size by altering the command to look something like this:
java -Xmx1g -jar ga2csv.0.1.jar recipes/visitors-by-page.xml output/visitors-by-page-output.csv
That extra parameter, -Xmx1g, tells the program to use 1 GB of RAM to get the job done, as opposed to its default 128 MB. Another way you can encourage faster performance is also run the program multiple times over smaller time intervals. I had to do that because I was pulling ~20k rows for each month. Running as a single pull overwhelmed the program, even when I bumped up to 1 GB max heap.
This is a great tool for Google Analytics users, and Keplar is awesome for making the tool publicly available. Data nerds and web marketing analysts: rejoice. You can bring GA data into Tableau now. My heart is smiling; how about yours?

