
Early last year, I got some bad news after a routine doctor visit. The specifics are unimportant, but the gist is that I needed to make some significant changes in my life while I was still young enough to do so. I’ve always been a big guy, and you might have known that if we’ve met at a conference or out in the field. I felt fine, so I never worried about my weight. Apparently, 290 pounds is a weight I needed to worry about. Fortunately for me, my doctor seemed quite confident that through better diet and exercise, I’d be able to set things right.
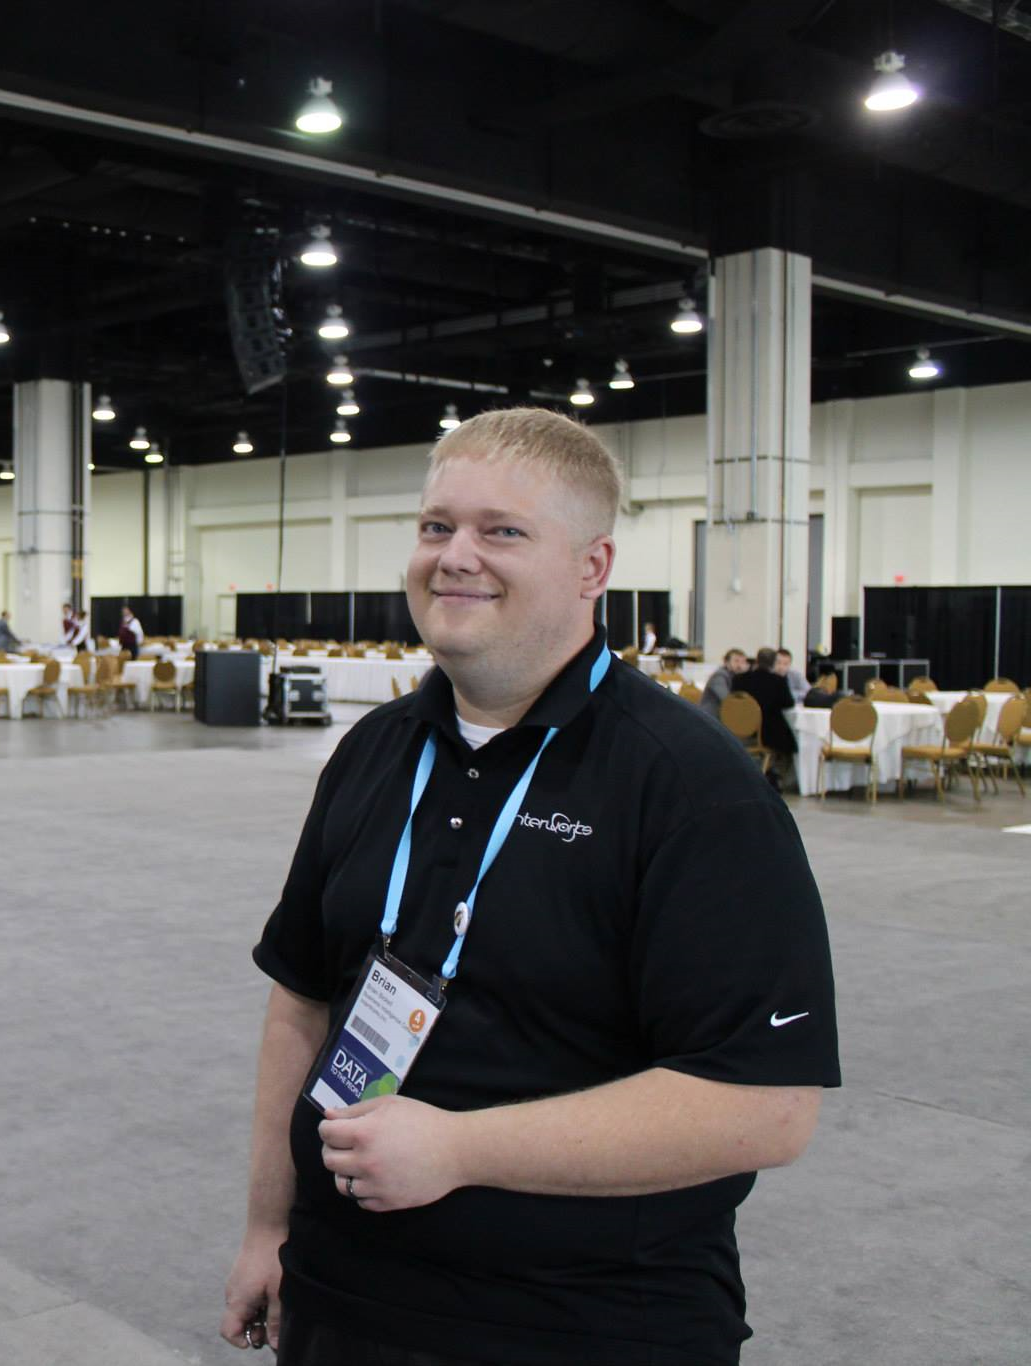
Above: OK, I was a bit heavy.
One trait that ties all InterWorkers together is that we’re good at getting things done. Once I had instructions from my doctor, I got to work. I aggressively altered my diet and bought a bicycle. The diet changes I’ll detail elsewhere. In short, I severely restricted my calorie intake and almost entirely cut out sugars. This post is really about the bike.
The Bike
This summer, I became the proud owner of an Electra Townie 3i which, for lack of a better description, is a laid-back, old-man cruiser. It’s heavy and it’s slow, but boy is it comfortable. What a cool bike.
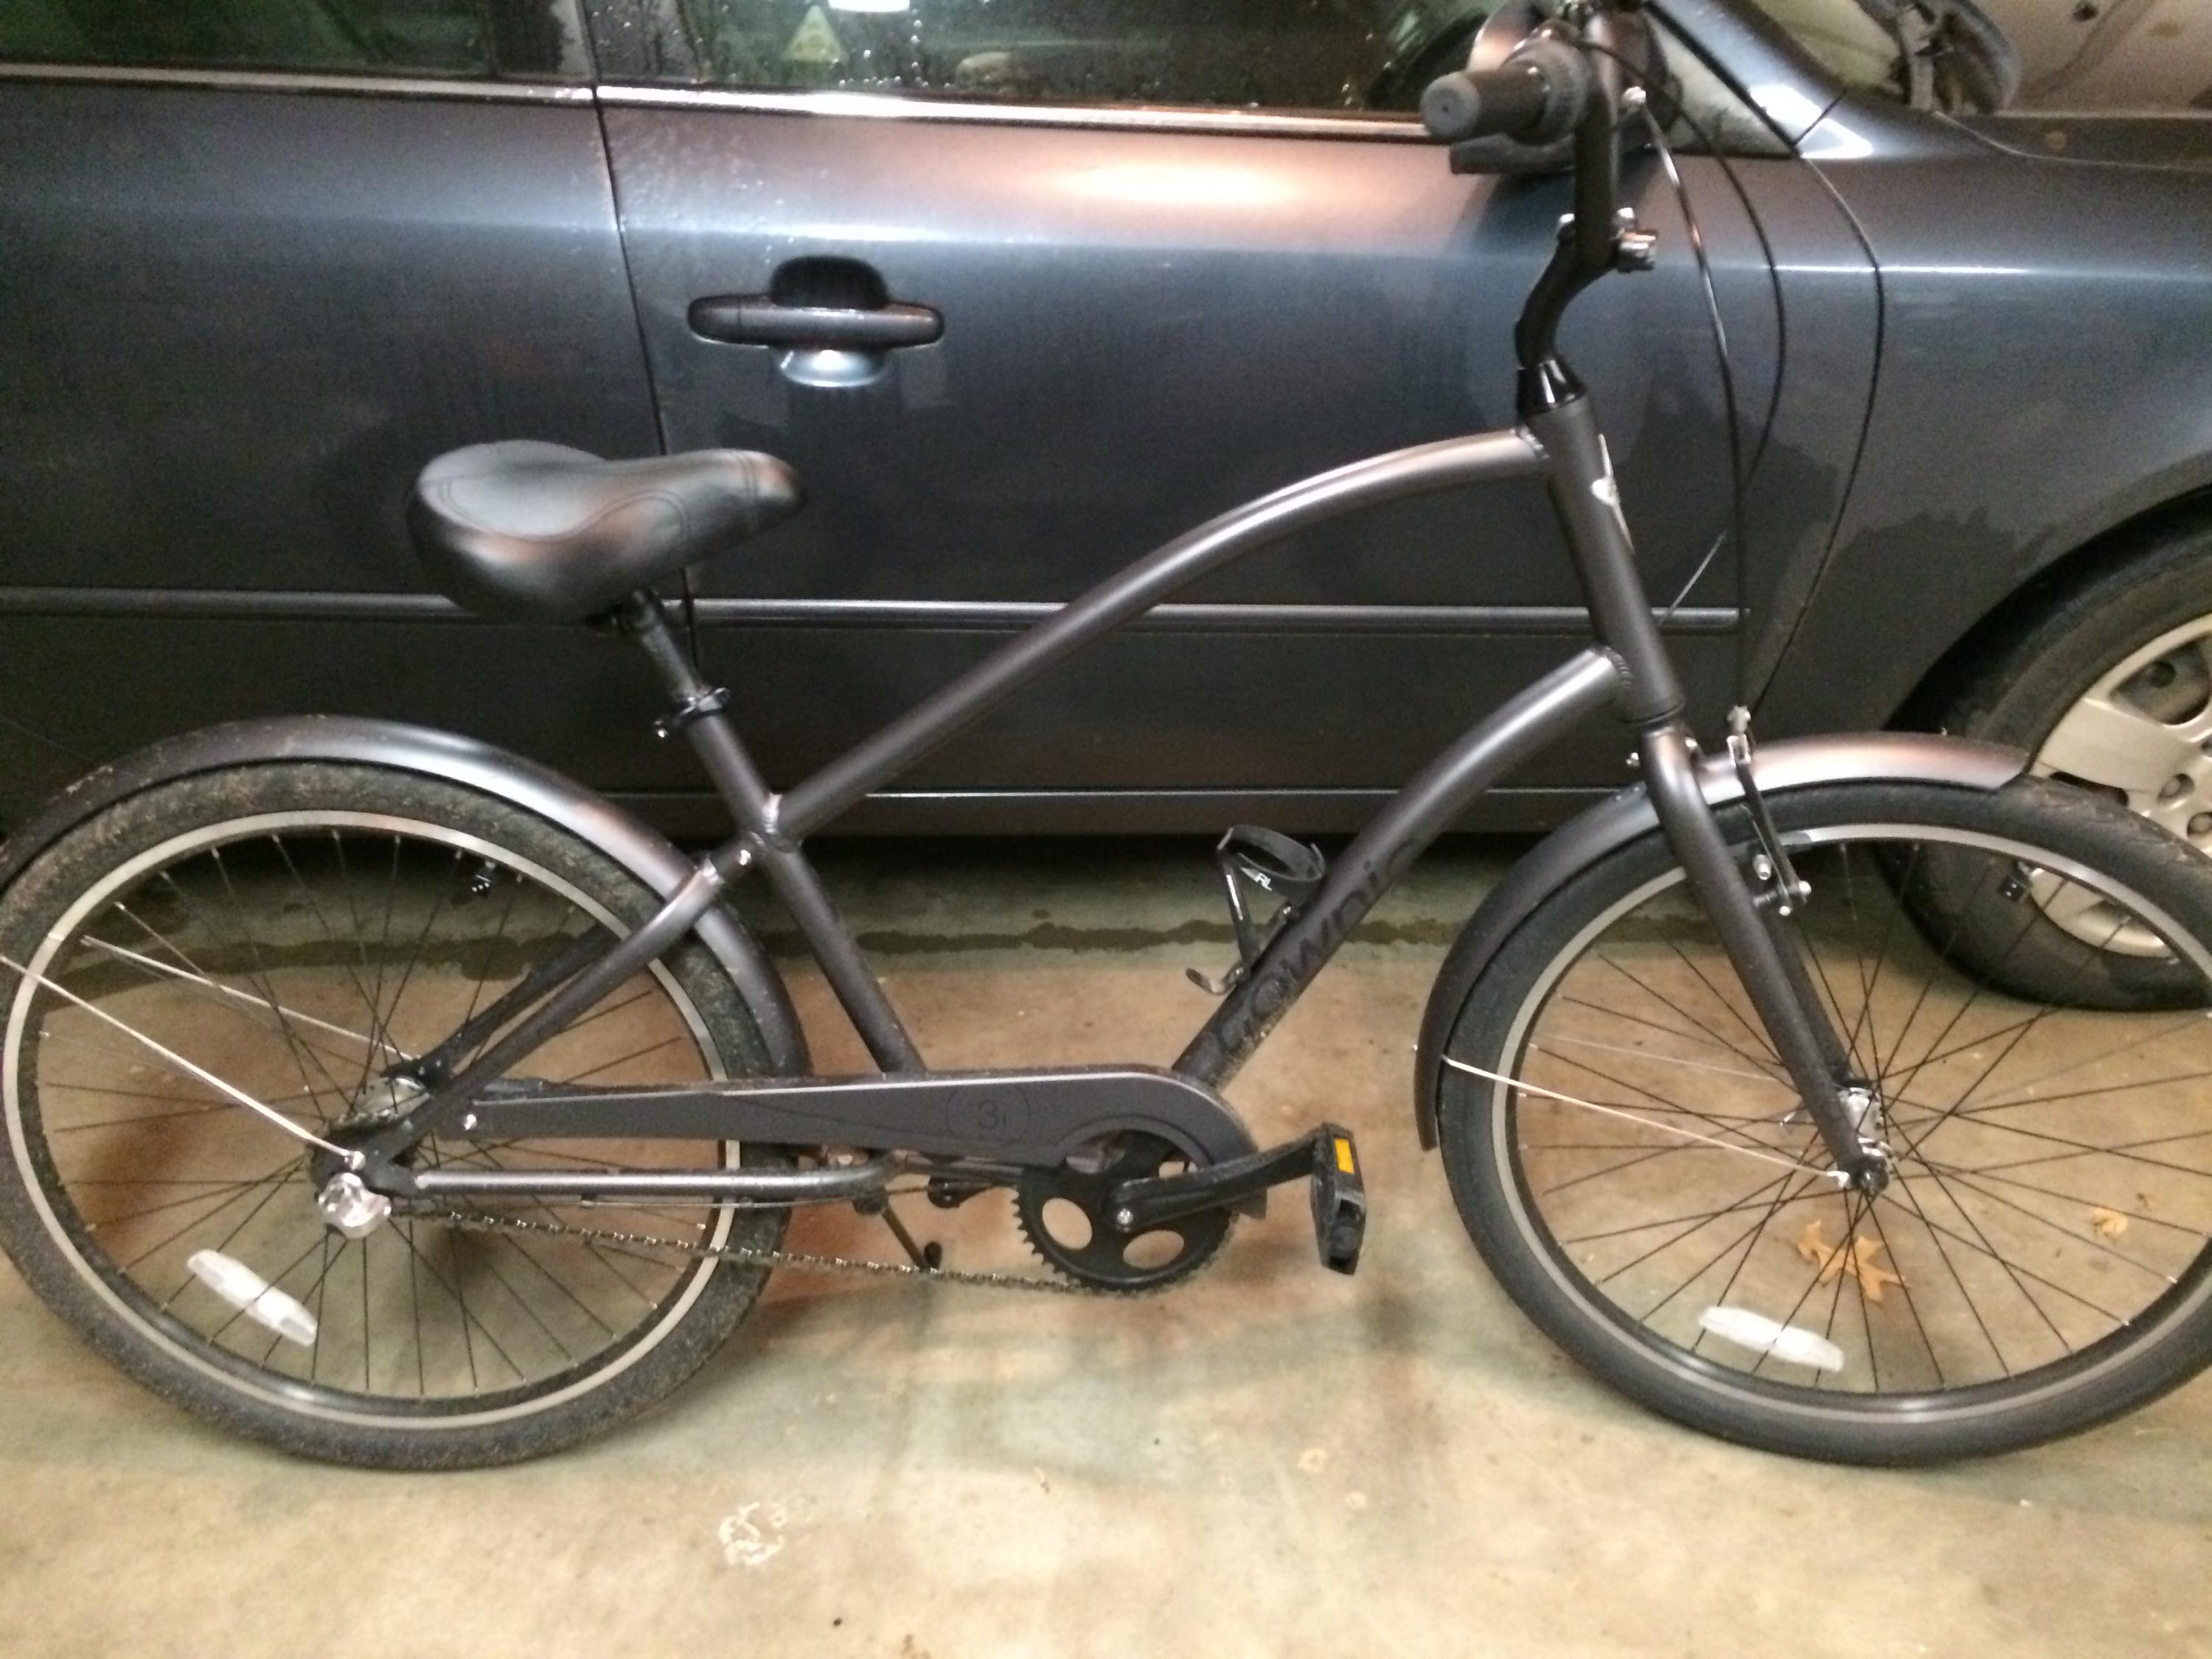
Above: Cruis’n Stillwater.
After years of inactivity though, pedaling it even short distances filled my lungs with lava. I can vividly remember my first four-mile ride around my neighborhood, making me wonder if anyone had died of exhaustion on such a short ride before. I remembered riding a bicycle as a kid being much easier.
In time however, and through constant work, the distance I could ride increased. Between that and the diet changes, I was also starting to lose a considerable amount of weight. The weight loss fed right back into the performance on the bike. As I got stronger and lighter, I could ride further. That, in turn, made me yet stronger and lighter. This loop has been playing out to great effect. In 2014, I lost a little over 80 pounds, with the majority of that being in the back half of the year after I started riding.
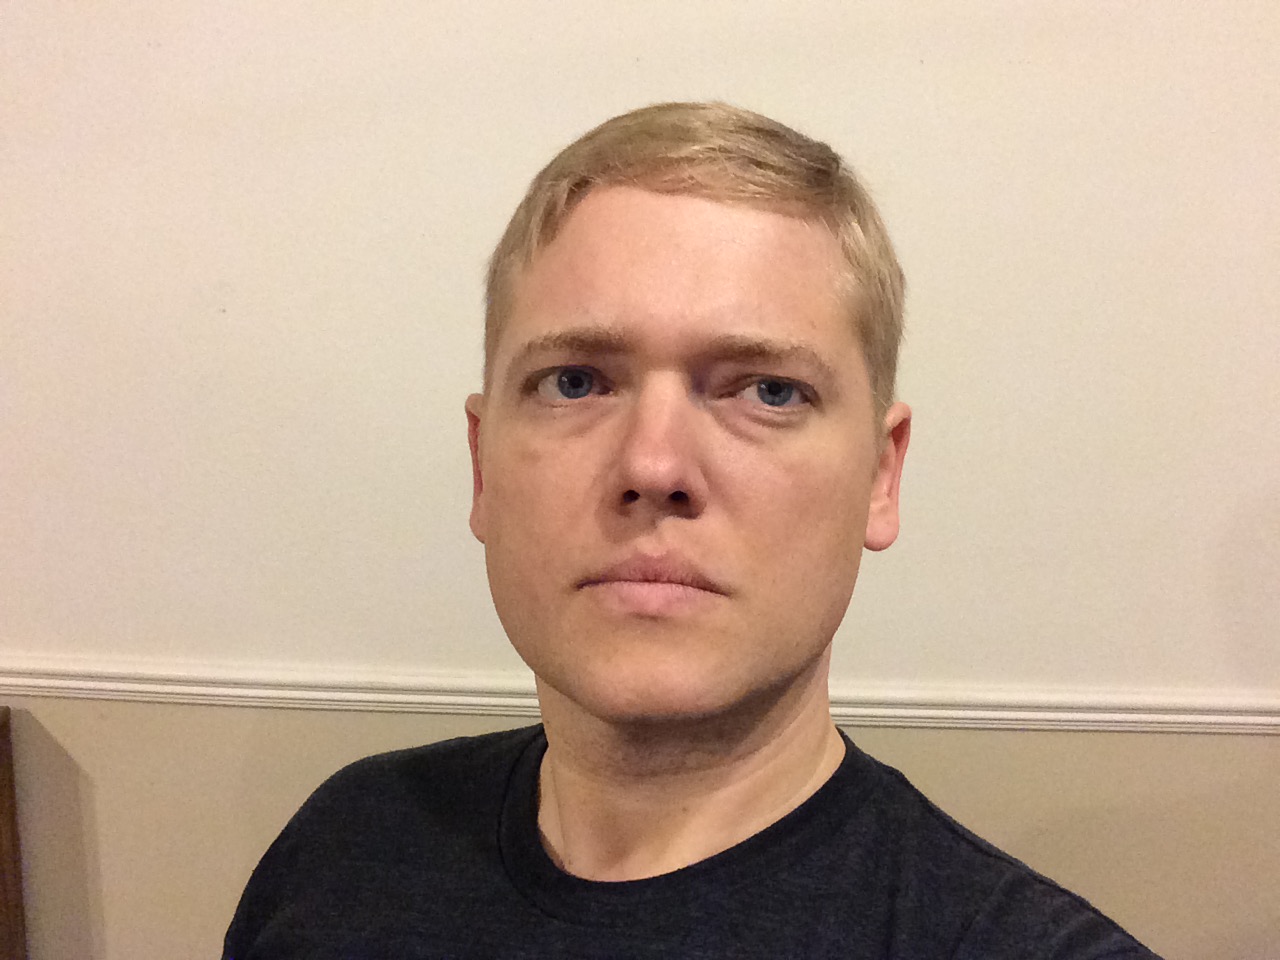
Above: Harder, Better, Faster, Stronger
I went back to the doctor in December 2014 and got a clean bill of health. Crisis averted. I was the healthiest I’d ever been. My doctor was floored, “No one ever does what I tell them to do.”
For most folks, that’d probably be enough. Problem appears, problem solved, pack it up and go about living life. I’m not like most people though. I had a taste for cycling and wanted to see how far the rabbit hole went. I set my sights on racing. I did my research and discovered that to reliably get faster and stronger, I’d need to start a more deliberate training program. I also discovered that this training produces a wealth of data that could be captured.
Well friends, here at InterWorks we’re all about that data.
Capturing Data with KICKR
The training setup I landed on for the winter months is built around the Wahoo KICKR, which is a high-end electronic trainer. Basically, you take the rear wheel off the bike and hook it up to the KICKR and you ride. The KICKR supplies the resistance and can be controlled by PC or phone with Bluetooth or ANT+. My setup is all based on Bluetooth connectivity. With the KICKR, I can ride workouts that raise or lower the resistance I’m pedaling against depending on the goals of the workout. It also captures the most important cycling metric – power. Cycling power is measured in watts. This directly measures the amount of work a cyclist is able to do.
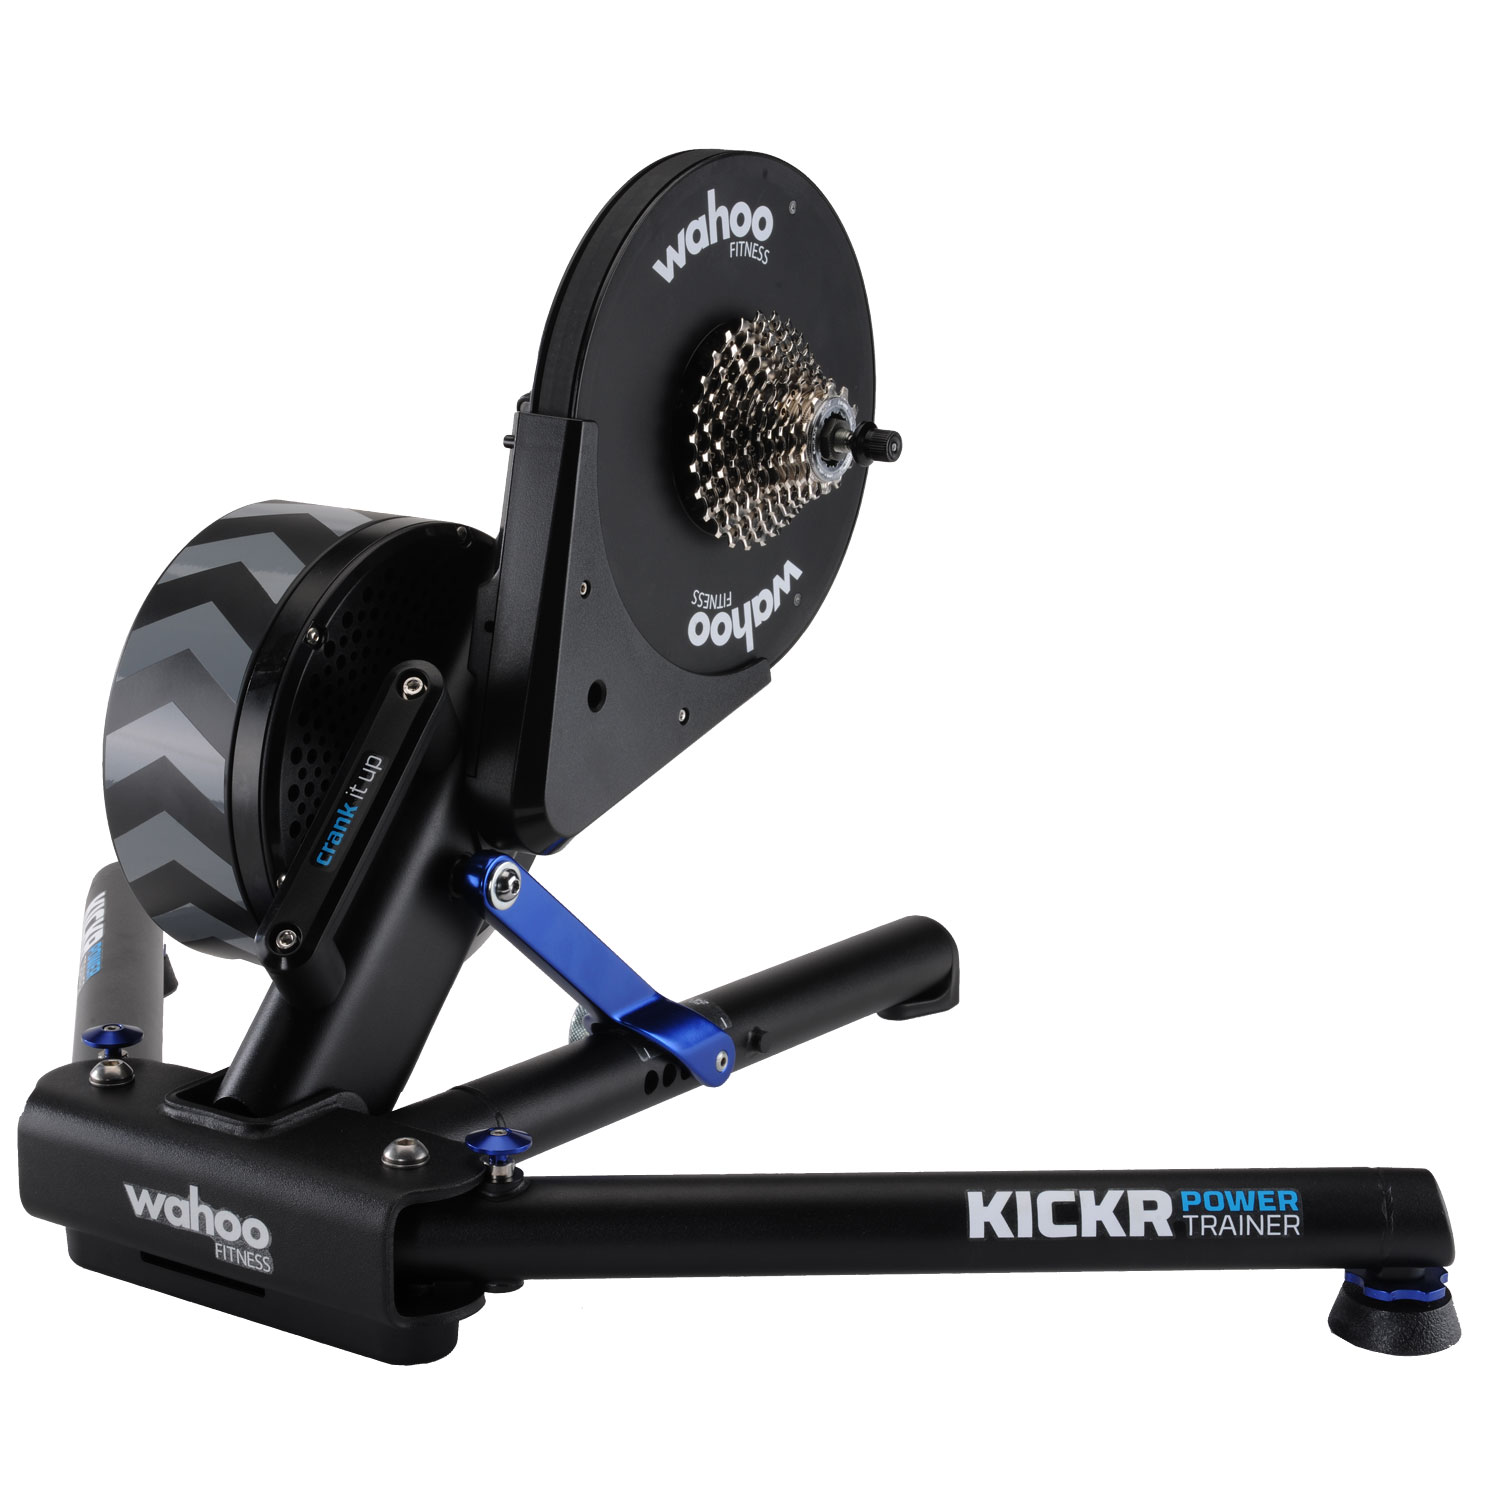
Above: I, for one, welcome our trainer overlords.
In addition to the trainer, I have a few other sensors from Wahoo. Specifically, I use the Wahoo Blue SC to record cadence. Cadence is a measurement of the number of revolutions of the crank per minute. In other words, how fast the cyclist is pedaling. Since the formula for watts is watts = force x cadence, a rider generates the same amount of power with less force applied at the pedals by maintaining a higher cadence.
I record heart rate in my stack with the Wahoo TICKR X. Heart rate tends to be a little bit less useful as a metric in cycling since we already have a good way to measure how hard we’re working in watts. Heart rate gets used as a proxy for effort, but power fits the bill better. I record it all the same as a curiosity more than anything.
All of the sensors and the trainer in my setup are controlled by and stream data to a laptop with a Bluetooth dongle. This laptop is running training software from TrainerRoad, which controls the workouts and captures the data. If you’re serious about cycling, I highly recommend TrainerRoad. Their software and their workout plans are top notch. Simple, automated data capture is the icing on the cake. Sure, it’s $10 per month, but that’s nothing if you gotta go fast.
As great as TrainerRoad is though, it doesn’t provide anything like external database access or an API to connect to. The best we can do is to download the captured data from our workouts in the TCX format. TCX is a Garmin format (Training Center XML). If we’re going to get this data into Tableau, as you’re no doubt expecting by now, we’ll first have to parse it into a format Tableau can read. Luckily, that’s not too difficult.
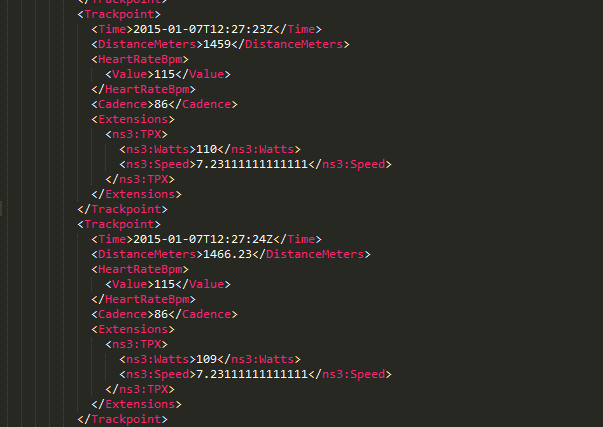
Above: I really hate XML.
Preparing the Data for Tableau
Whenever I need a language to get stuff done, I always look to Python. This small job is no exception. Knowing that I’d be parsing an XML file, I thought first about the wonderful lxml. With a few hours of fiddling, I had a simple but sufficient TCX parser built.
###############################################################################
##
## tcxparse.py - a dead simple tcx file parser
## Author: Brian Bickell / InterWorks
## What it do: Parses a .tcx file and emits pipe delimited records to stdout
## Usage: python tcxparse.py > output.txt
##
###############################################################################

import lxml
import time
from lxml import objectify
from lxml import etree

namespace = 'http://www.garmin.com/xmlschemas/TrainingCenterDatabase/v2'

###############################################################################
## Setup
###############################################################################

ftp = 220;
workout_name = 'Fin';
weight = 205;

file_name = 'C:devpythontcxbbickell-2015-01-07-fin-1442575.tcx'

tree = objectify.parse(file_name)
root = tree.getroot()
activity = root.Activities.Activity

sport = activity.attrib['Sport'].lower();

start_time =  activity.Id.pyval;

seconds = 0;

## tcx file format supports laps but for my workouts the lap specific aggregate
## data is not really useful
for lap in activity.Lap:
	lap_start_time = lap.attrib['StartTime'];
	lap_total_time = lap.TotalTimeSeconds.pyval;
	lap_distance = lap.DistanceMeters.pyval;
	lap_maximum_speed = lap.MaximumSpeed.pyval;
	lap_calories = lap.Calories;
	lap_avg_hr = lap.AverageHeartRateBpm.Value.pyval;
	lap_max_hr = lap.MaximumHeartRateBpm.Value.pyval;
	lap_intensity = lap.Intensity.pyval;
	lap_cadence = lap.Cadence.pyval;
	lap_trigger_method = lap.TriggerMethod.pyval;
	## I started out capturing this stuff but I was never really sure what to
	## do with it so I got rid of it.
	#print '%s | %s | %s | %s | %s | %s | %s | %s | %s | %s' % (lap_start_time, lap_total_time, lap_distance, lap_maximum_speed, lap_calories, lap_avg_hr, lap_max_hr, lap_intensity, lap_cadence, lap_trigger_method);

	for point in lap.Track.Trackpoint:
		point_time = point.Time.pyval;
		point_distance = point.DistanceMeters.pyval;
		## TCX can be a bit funny, sometimes the sensors have a hiccup and we
		## don't get a reading for that point. In that case I just want a 0
		## instead of an exception. Honey badger don't care.
		try:
			point_hr = point.HeartRateBpm.Value.pyval;
		except:
			point_hr = 0;
		try:
			point_cadence = point.Cadence.pyval;
		except:
			point_cadence = 0;

		for el in point.Extensions.iterchildren():
			try:
				point_watts = el.Watts.pyval;
			except:
				point_watts = 0;
			try:
				point_speed = el.Speed.pyval;
			except:
				point_speed = 0;
		print '%s | %s | %s | %s | %s | %s | %s | %s | %s | %s' % (point_time, point_distance, point_hr, point_cadence, point_watts, point_speed, seconds, workout_name, ftp, weight);
		seconds = seconds + 1;
Above: #TODO: Software engineering.
When writing parsers, which I do more of than you might think, I tend to start off by just emitting the records to the stdout and redirecting to a file. Hey, it gets the job done.
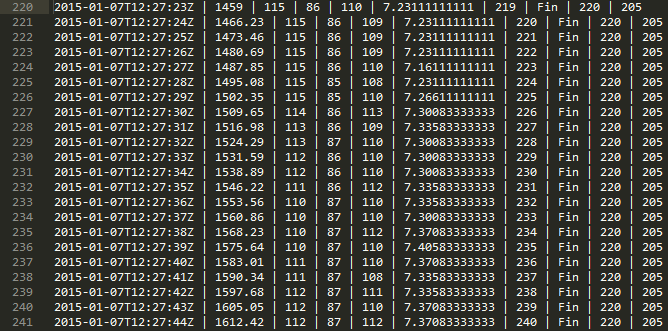
Above: Pipe-delimited text is the one true format. If you disagree, you’re wrong.
Building the Dashboard in Tableau
Now that we’ve got data in a format we can easily work with in Tableau, it’s time to build something. Below is a dashboard built with data I captured from a recent interval workout and parsed with the above code. Click on the image to interact with the visualization:
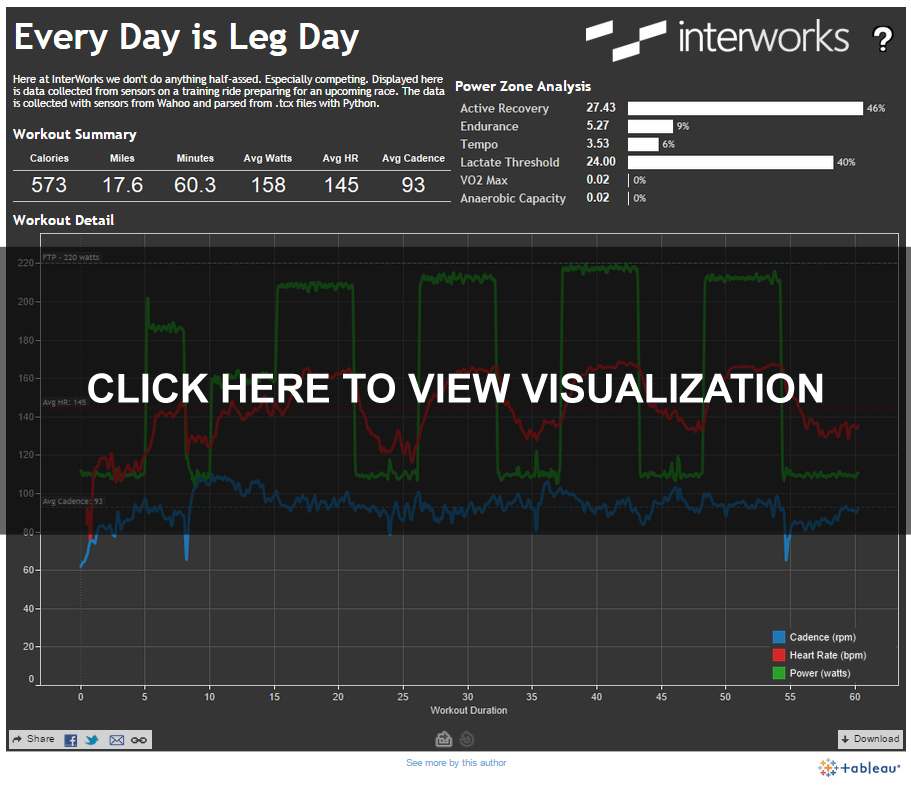
You can see from the visualization that this workout is a 4×6 minute interval exercise. Another point about cycling I should mention: FTP is functional threshold power. This is the amount of power a cyclist can produce for one hour. It’s the best indicator of cycling performance. My current FTP is 220 watts. The goal of this interval exercise is to increase my FTP by riding near it in a prescribed way. This power zone is called lactate threshold. Check the link for more details if you’re interested. In between each of the intervals, you can see a period of lower power output. This zone is called active recovery. I’m still pedaling here, but this is light enough work that my heart rate is actually decreasing.
In this session, I did 60 minutes of work and burned approximately 570 calories. At an average of 93, my cadence for this workout was good as well. Generally, I look to keep it over 85 to prevent myself from putting too much strain on my knees by stomping down the pedals. I include miles in the summary so I have some idea, but I find it’s kind of dodgy coming from a trainer. That said, it can still be a useful number to explain to non-cyclists how much work you did. Most normal folks don’t understand how to quantify one hour at 158 watts, but they can grasp miles even if they don’t ride.
How Visualizing My Data Helps
Capturing data from my training sessions and visualizing it with Tableau is helping me prepare for several upcoming events this year, including my most immediately pressing race, Land Run 100. It’s a 100-mile, self-supported gravel race on the dirt roads of Oklahoma in March 2015. I’m also riding in OK Freewheel, a seven-day bike tour that traverses Oklahoma south to north, this year with Team InterWorks. Last year’s route came in at 460 miles for that event, so I definitely have some more training to do, but I feel confident.
Oh, and lest you think I’ll be riding these events on the cruiser, I upgraded to something just a little bit faster at the beginning of this year.
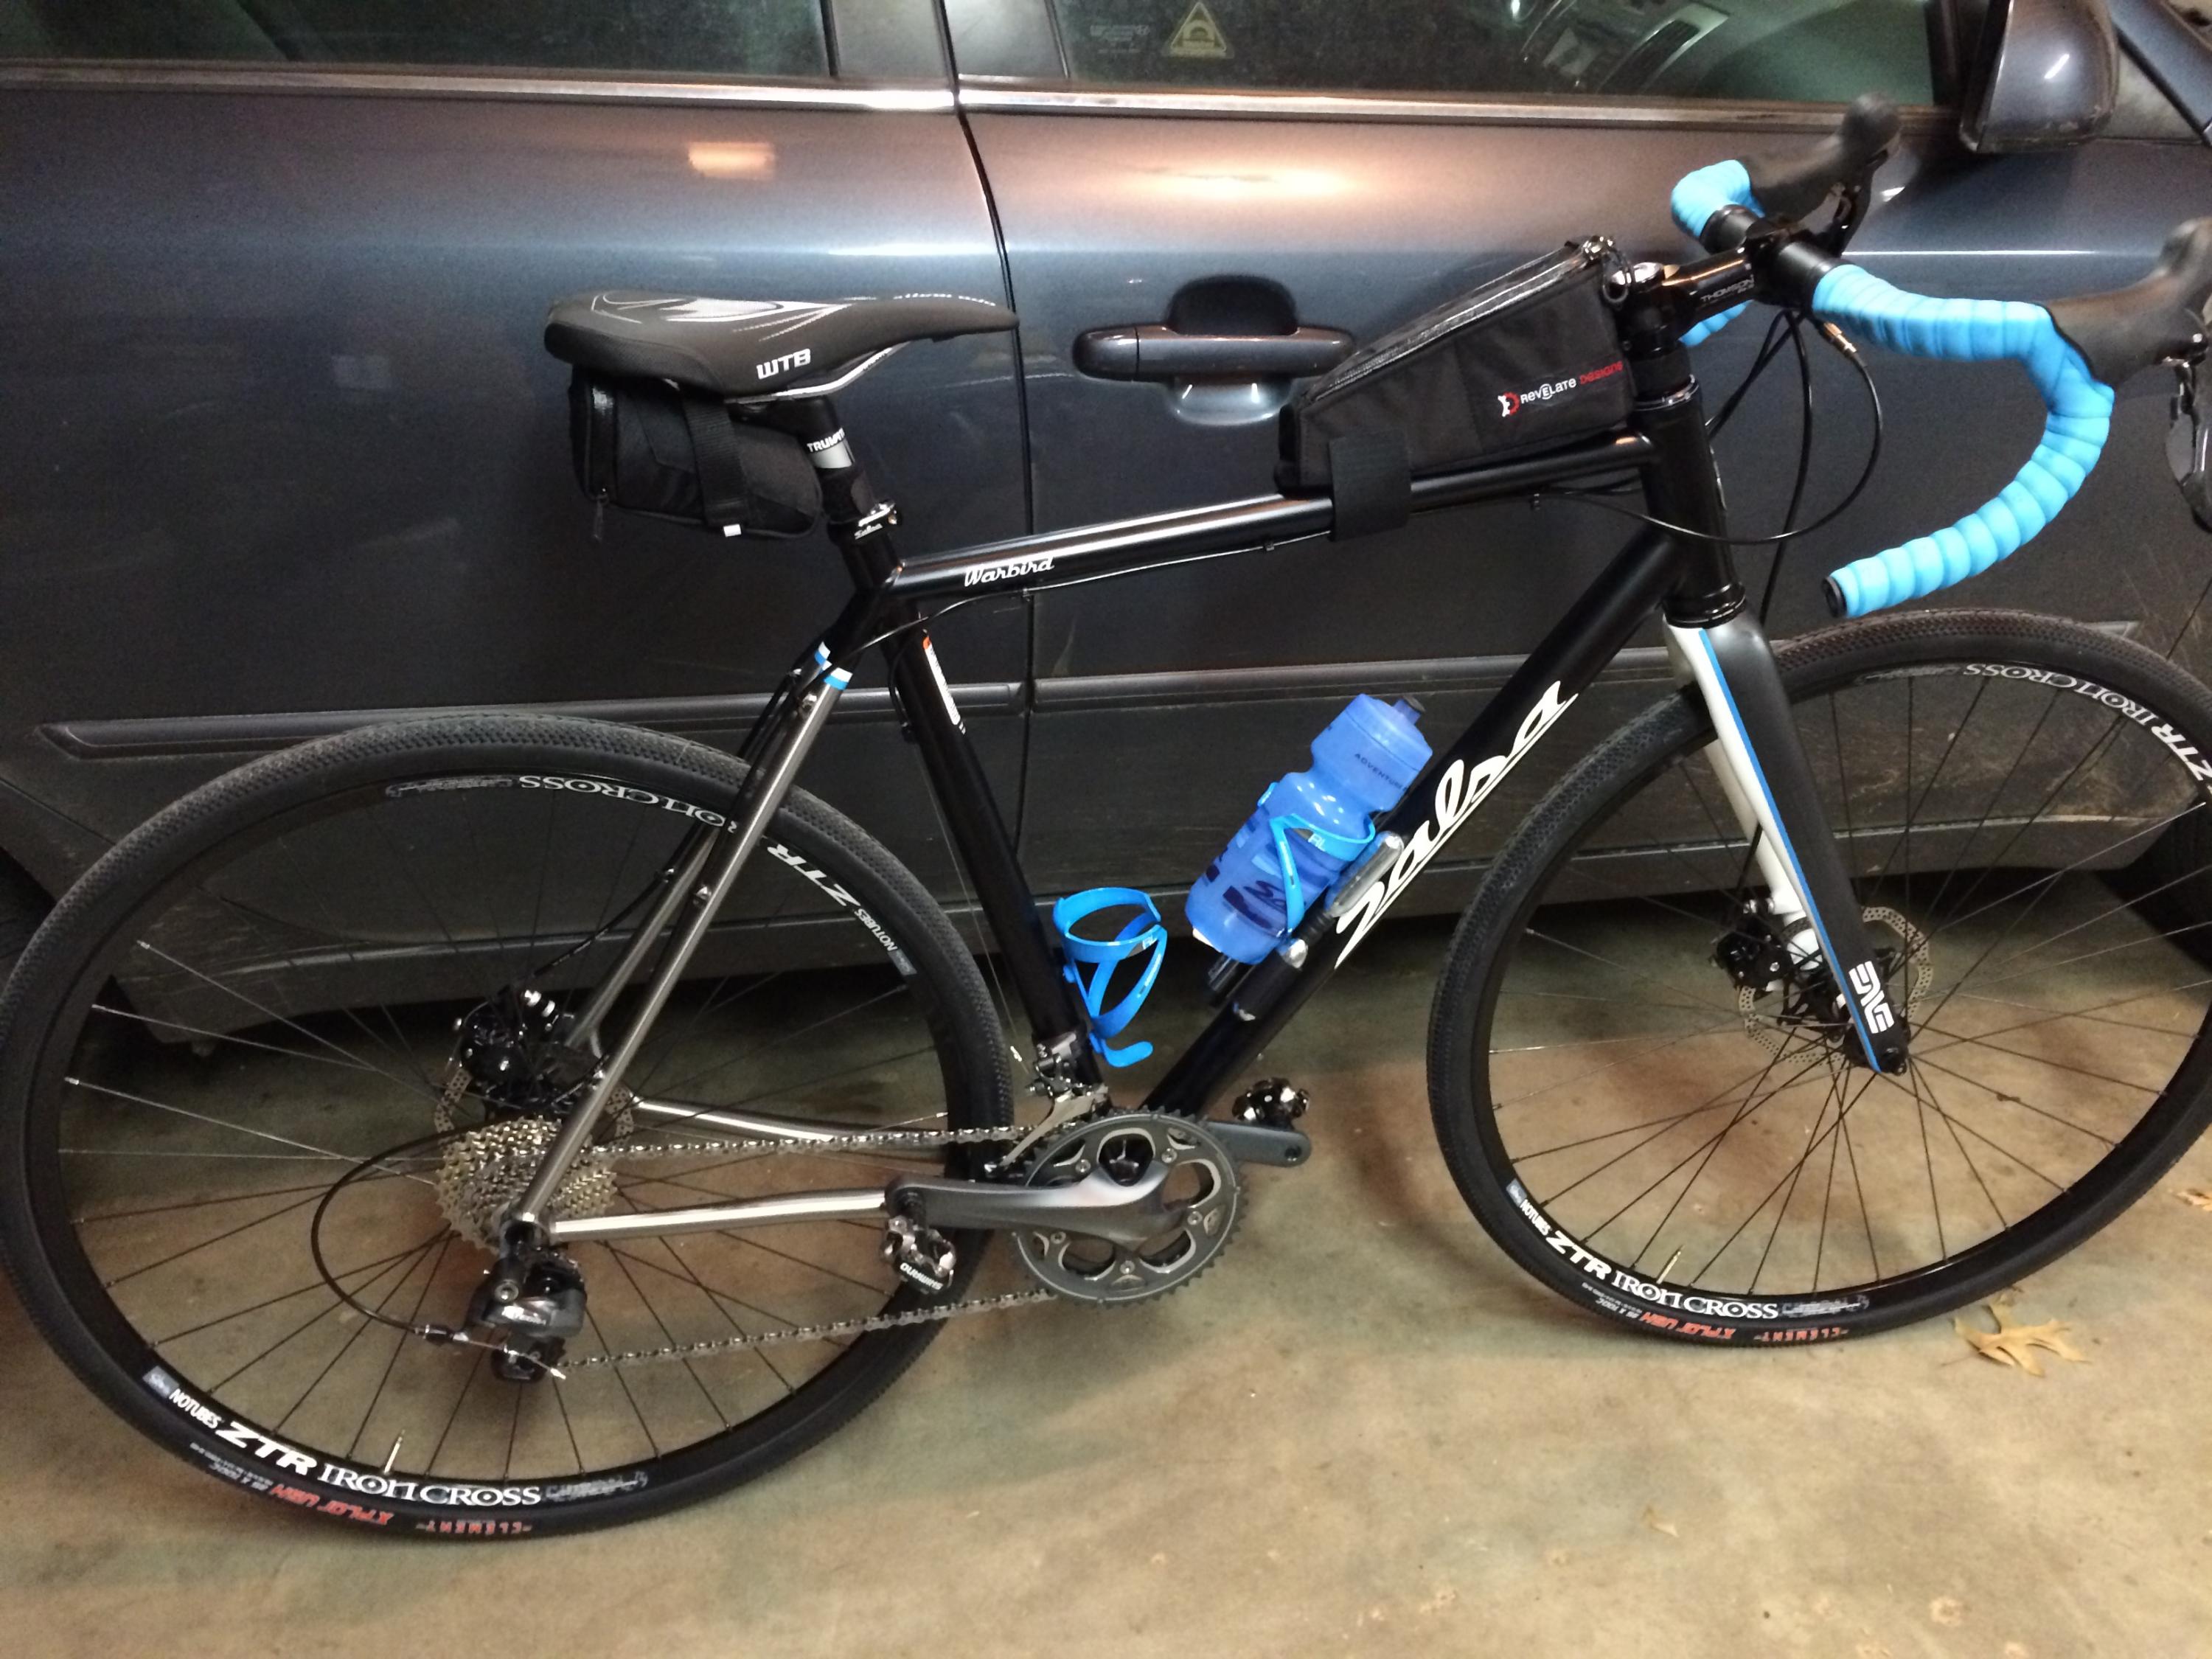
Above: Gotta go fast.
I’ve been using Tableau as a part of my job for the last seven years or so now, but I’m still finding novel uses for it outside of work. That really speaks to just how incredible it is.