
The first keynote was about vision, but Devs on Stage is all about the features analysts most want to see. Let’s dive into what was shown and what you can expect in future Tableau iterations.
Analytics
Maraki Ketema, an engineer on the Analytics team, was the first to step up and get the night started with a bang. She showed off the Automatic Drill feature, which allows Tableau to change the level of aggregation on a chart as you zoom. Imagine looking at a map of the United States with data at the state level. Click to zoom in, and Tableau automatically adjusts to the view to the county level. This should prove to help provide a more intuitive interface for interacting with map data.
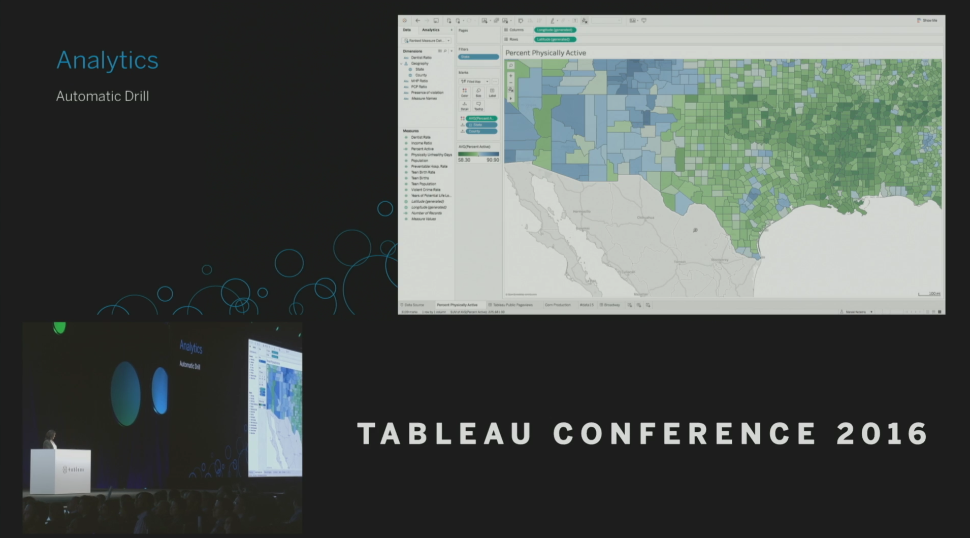
Above: Automatic drill adjusts your viz as you zoom.
Perhaps bigger news for anybody regularly using mapping data is Tableau’s new Spatial File Connector. Combined with the Map Layers ability discussed in the first keynote, this will allow users to easily add and layer custom shapes to their analysis. This connector will be part of the 10.2 beta and will include the ability to connect to .kml, .shp, .tab, .mif and .geojson file types.
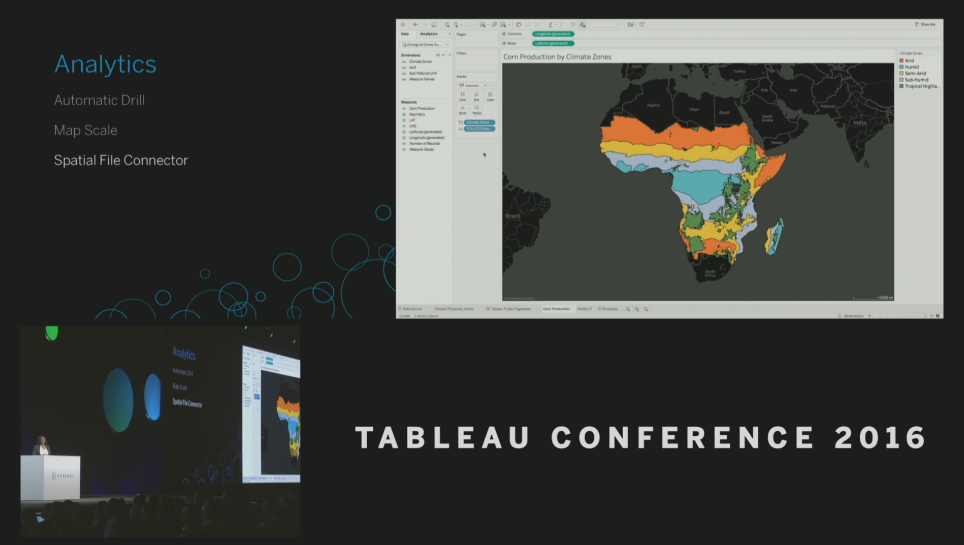
Above: Import unique shapefiles like climate zones with Spatial File Connector.
Next up, Python Integration was shown off. This is a huge addition since many people use Python as their primary way to process advanced analytics, rivaling the use of R in many parts of the industry. Like R integration, it requires a separate server and will use the familiar script functions within Tableau. We haven’t tested it yet, but it should provide the same benefits and have similar limitations to R integration. You can start using this today. For more information, check out this article.
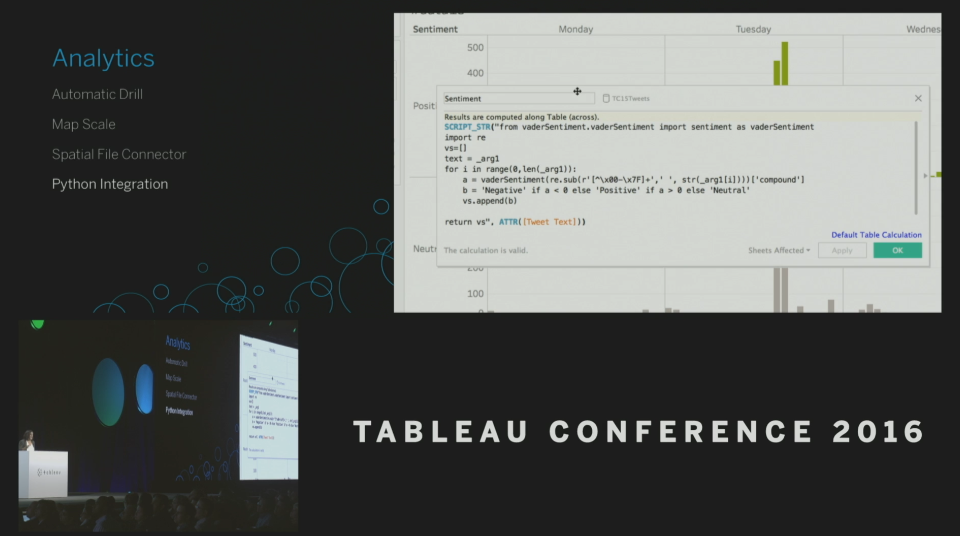
Above: Using Python directly in Tableau.
Maraki next showed off Tooltip Selection. I’m excited about this one, since it gives another easy-to-use method for people to interact with my visualizations. She showed off a scatterplot of Broadway shows, with the tooltip providing additional categorical information like the type of show, such as “Mega Hit”. From the tooltip, she was able to click the “Mega Hit” category to highlight all other shows that fell into that bucket. This will work with any of the categorical information and make it easier then ever to highlight relevant points. This will be huge for filtering and highlighting data easily.
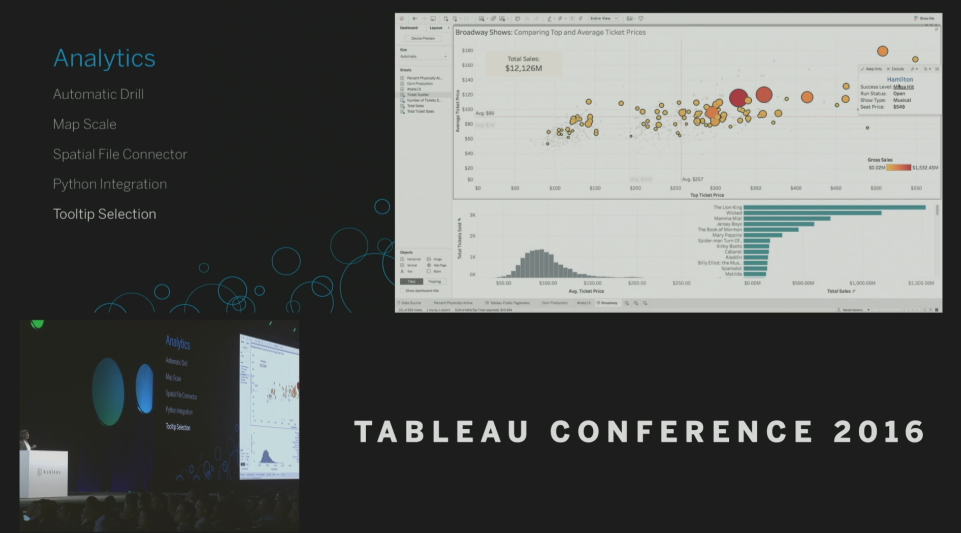
Above: Tooltip selection allows for more robust analysis.
Removing the need for some common Tableau Hacks, Filter Presets is going to make it easier then ever for people to be looking at exactly the data they need to when they open your dashboard. These presets can be set in the edit filter menu under a new Presets tab. Two options were shown, latest date and current date. I’ll be making use of this feature regularly to make sure people see the latest and greatest data available.
Step and Jump Lines were another feature shown. Maraki demoed a new control addition to the Marks card that allowed you to control the line type. They even showed off an outline of the Austin skyline using this new feature. It’s great to see yet more flexibility in how you can present your data.
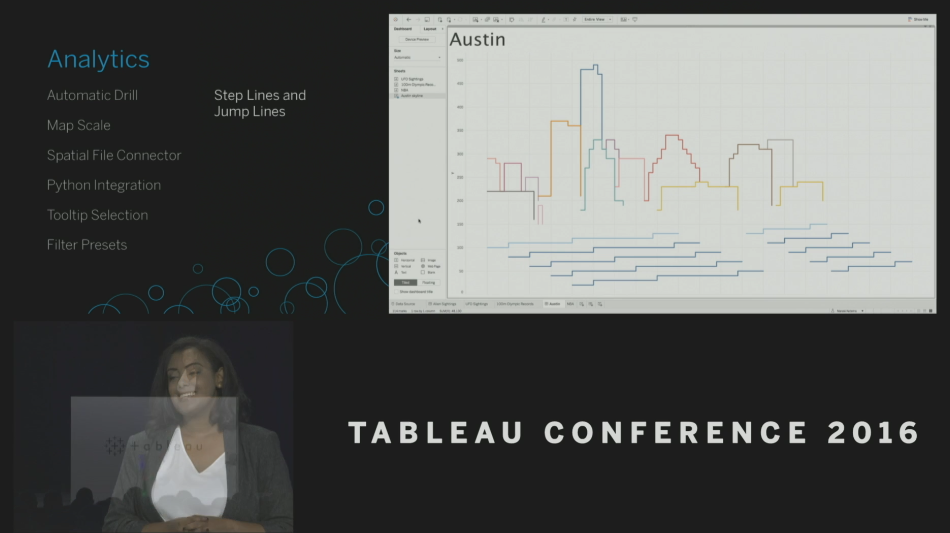
Above: An outline of Austin using Step and Jump Lines.
In something that is a very common request, the Legend per Measure feature allows you to create unique color ranges and styles for each measure in your visualization. This has been achievable in the past, but the process wasn’t easy or obvious. This will make a lot of users happy and save a lot of time and frustration.
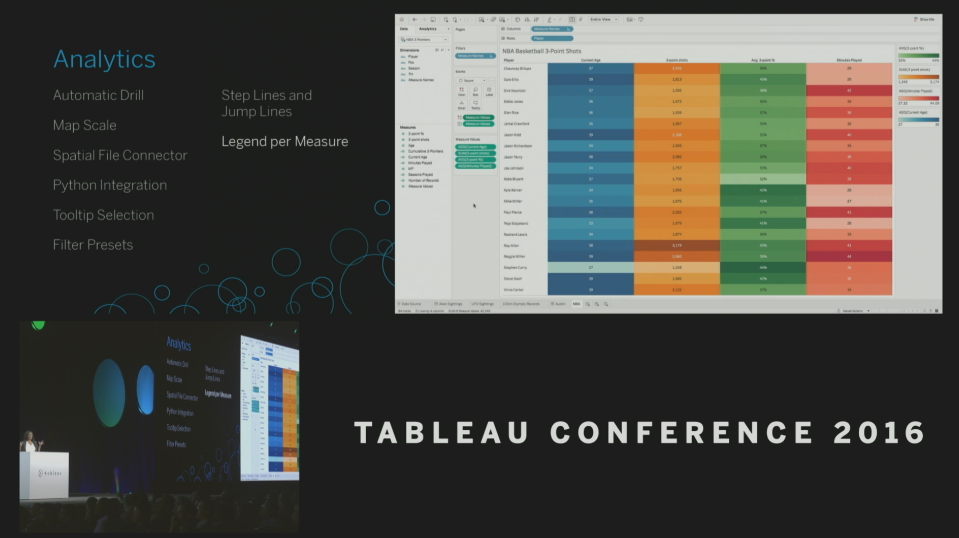
Above: You can finally go nuts with those legends in Tableau.
Dashboard & Stories
Next on stage was Senior Software Engineer Steph Diesel. She focused on how some new tools could help you create the perfect design for your end users.
Spacing and alignment are huge for communicating to your users. In the past, Tableau has required a lot of small adjustments to get things perfect. Now, a new option called Distribute Evenly is available for every container on your dashboard, giving you even, balanced distribution to your charts.
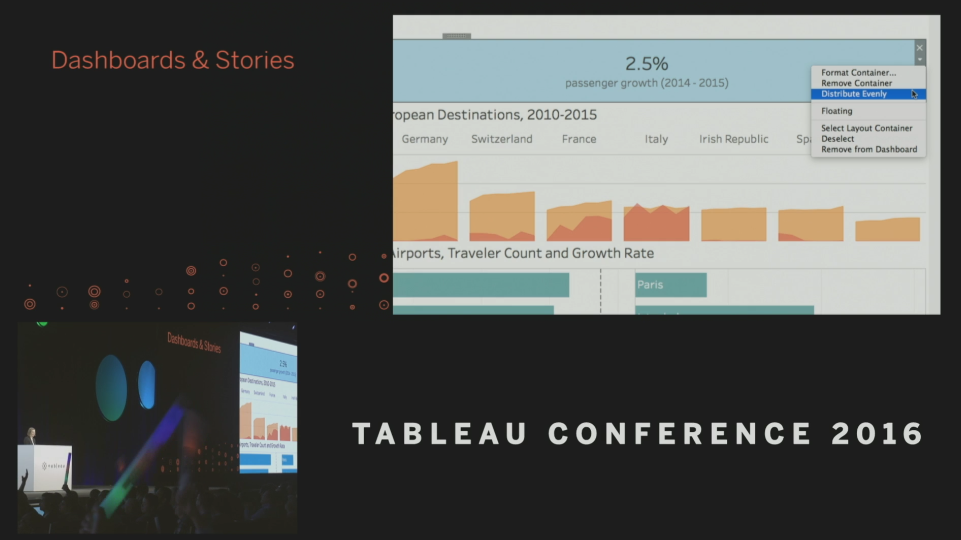
Above: Balancing your charts is now much easier.
New dashboard formatting options were also added, giving you Margin and Padding Control. Any designers or web developers will be familiar with these concepts, but in short it will give you exact control over how your worksheets fit together. Along those same lines, you’ll also be able to add Borders to any object. This was limited to containers in the past, which often required several steps to get things exactly right. Continuing the pixel-perfect design theme, the Expressive Text Editor is going give users the ability to create richly formatted text (including hyperlinks!) allowing you to fill out your analysis and to do it in style.
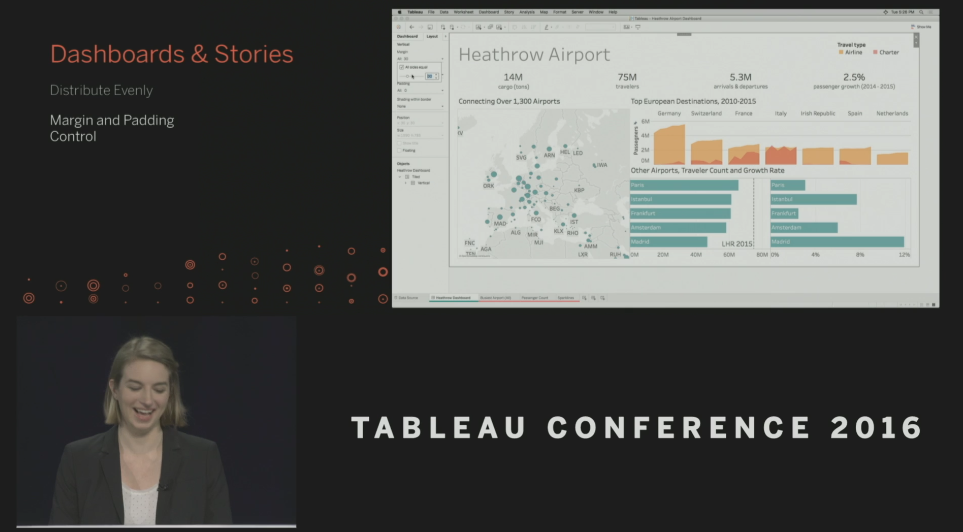
Above: Margin and padding control give you more flexibility when styling your dashboards.
We already heard in the first keynote that Web Authoring was going to reach feature parity with Tableau Desktop, but Steph showed the progress they’ve made toward that, quickly demoing Mapbox integration, hiding headers, adding reference lines, formatting headers, disaggregation and number formating all from the browser. The big highlight, though, was the introduction of Story Points on the Web. This will allow your Tableau Server users to create data-driven presentations right where they consume your dashboards. To help in these presentation, they’ve also added a Full-Screen Mode to help remove the chrome around your browser, to keep peoples’ focus on your data and not what you bookmarked.
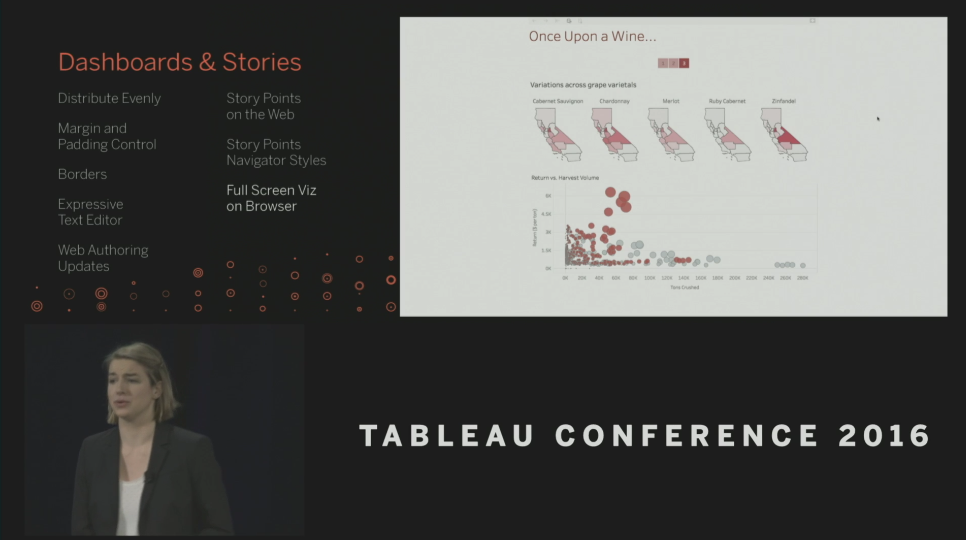
Above: A host of new web features for Tableau.
Mobile
To show us the new ways we can use Tableau on the go, Senior UX Designer Britta Nelsen joined the stage. First up, they showed off Direct Linking. This allows you to go straight from a link in your email, for instance, to the Tableau app. This should save clicks and make sure you get the best experience possible.
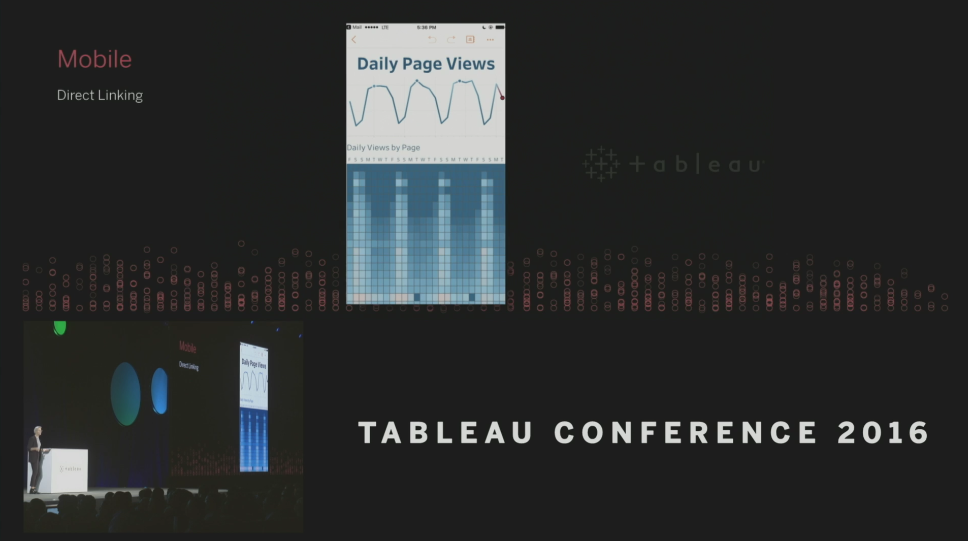
Above: Save clicks with Direct Linking.
Next up, Britta showed off Smooth Tooltips for Mobile, which greatly improves the experience of viewing tooltip information. Now the tooltip shows up across the bottom of your screen, making them easier to see. Even better, Tableau gives you a guide that you can drag around with a simple press and hold. This will prove very useful and make small data points less frustrating to find and highlight, especially for the fat-fingered among us. Tableau has also added Commenting right in the mobile app, which will be welcomed by any companies leveraging Tableau’s commenting and will prove to help teams stay connected wherever they are.
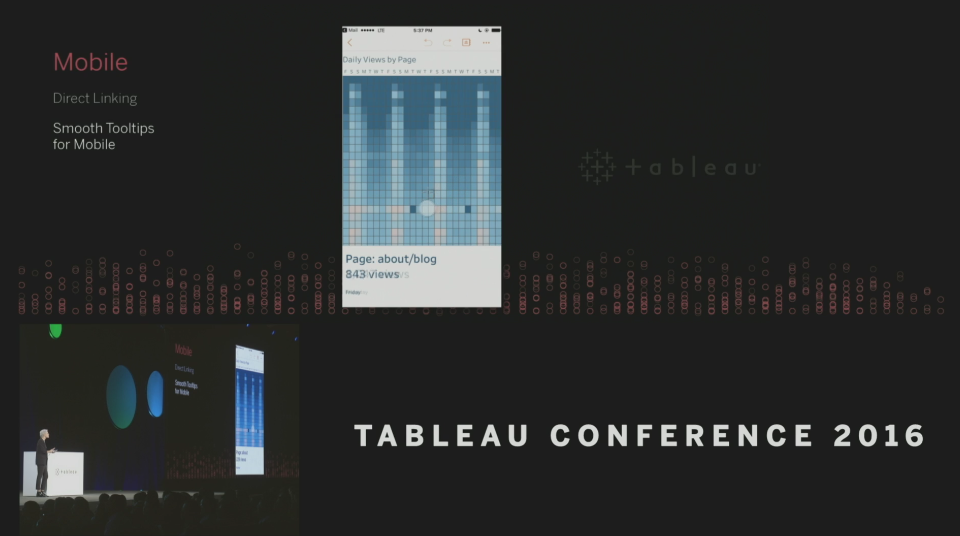
Above: Smooth tooltips improve Tableau’s mobile experience.
Finally, Tableau even has you covered in those times you’ve completely disconnected from the world, Offline Interactivity is going to allow you to remain connected to your data. This allows you to have a copy of your visualization in your mobile app and still remaining interactive with tooltips, selections, legends and highlighting. All the Mobile features will be available on iOS and Android.
Data
Zaheera Valani, Manager of Development, showed off features around data access and preparation. First, we visited the new Join on Calculation feature. This will allow you to write calculations right in the Data Connection window and create more dynamic joins. This should help a lot of users avoid outside data prep and gives me one less excuse to drop into custom SQL, which is something my business users will appreciate. Union has also been improved. When it was introduced, it was limited to local files (Excel, text, etc.), but now you’ll be able to do it on any database.
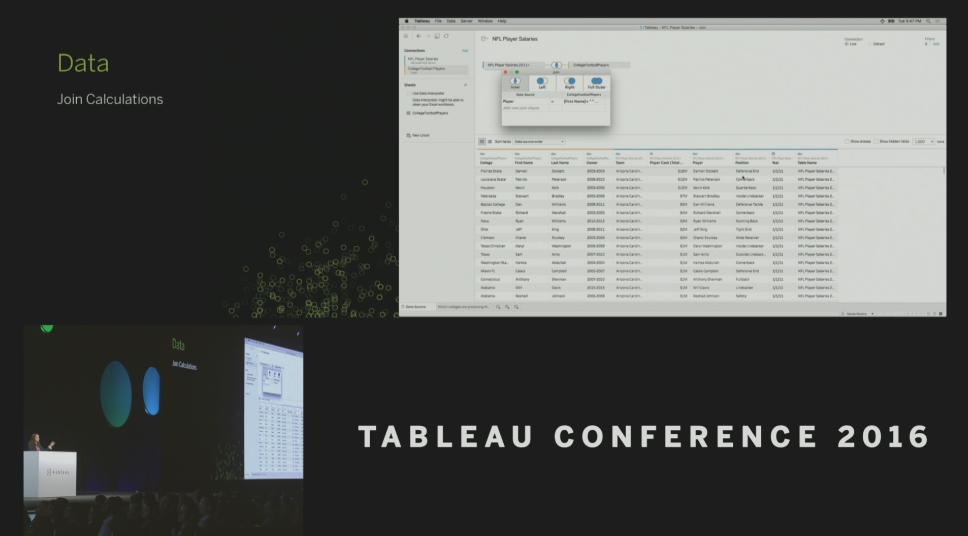
Above: Join on Calculations in action.
Continuing to add to Tableau’s amazing collection of connectors, Zaheera introduced several new connectors. The PDF Connector gives Tableau the ability to connect to PDFs and, using the Data Interpreter, enables them to read and understand the data that is in it. This should allow users to easily pull out the spreadsheets that might exist in PDF reports that have been sent your way.
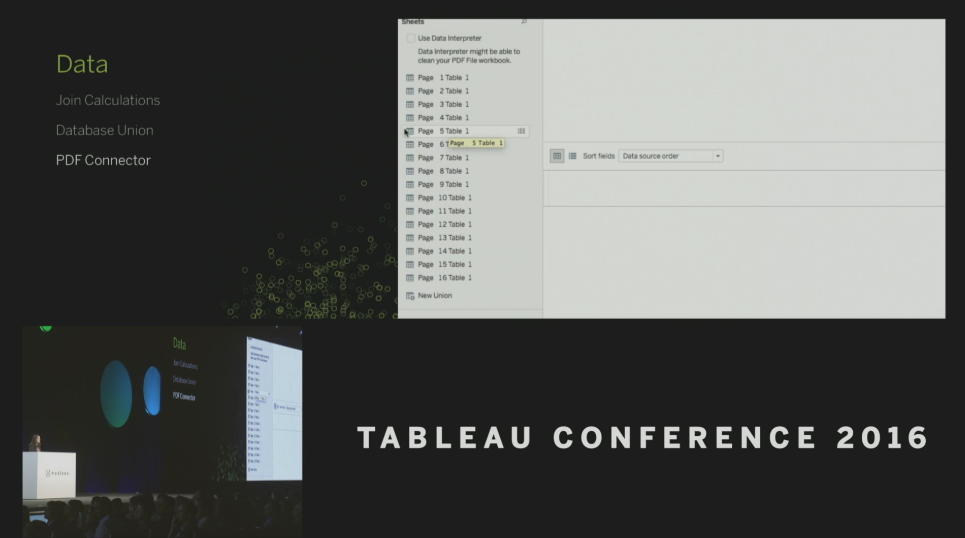
Above: Data extracted directly from a PDF in Tableau.
The JSON Connector is going to open up a whole host of new data source to users across the web. Tableau will read and understand the structure of the JSON file and allow you to select the level you want to be looking at. There’s a lot going on the background here that would normally require some custom code, so this is a really appreciated add if you have any JSON sources.
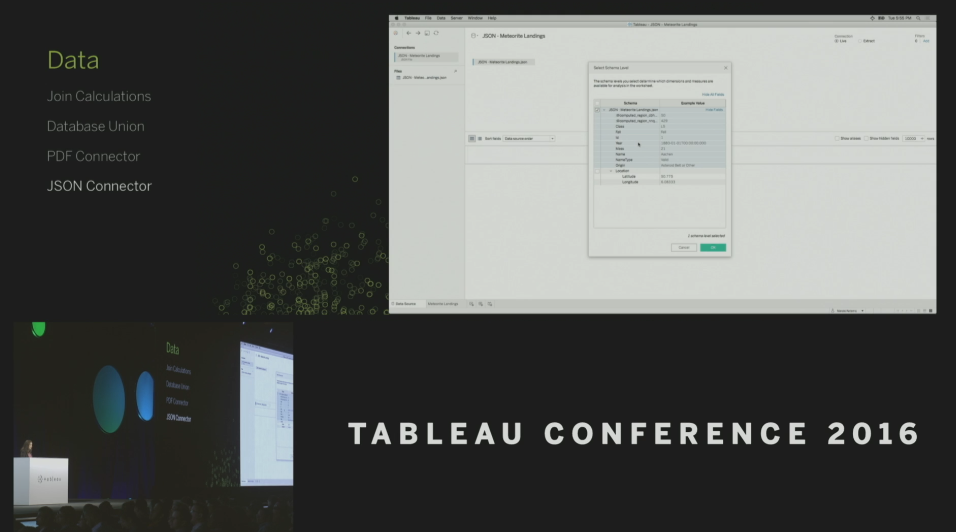
Above: The JSON Connector opens up a new realm of data source connectivity.
Extensibility
APIs are near and dear to the hearts of InterWorks, since they allow us to integrate Tableau deeper into our clients systems. So, it was a pleasure to watch Senior Product Manager Ben Lower show us some of the new ways we’ll be leveraging them in the future.
The new Server Client Library is going to help streamline many of the things that could be done with the REST API, which means less code and faster development time. System administrators should be thrilled that more tedious tasks are easier to automate then ever. Along those lines, the Document API is going to remove the need for a integration hack that required XML parsing to find out things such as the number of users or what workbooks were available on the server. It’s always key for production code to be streamlined and supported, so this is great to see.
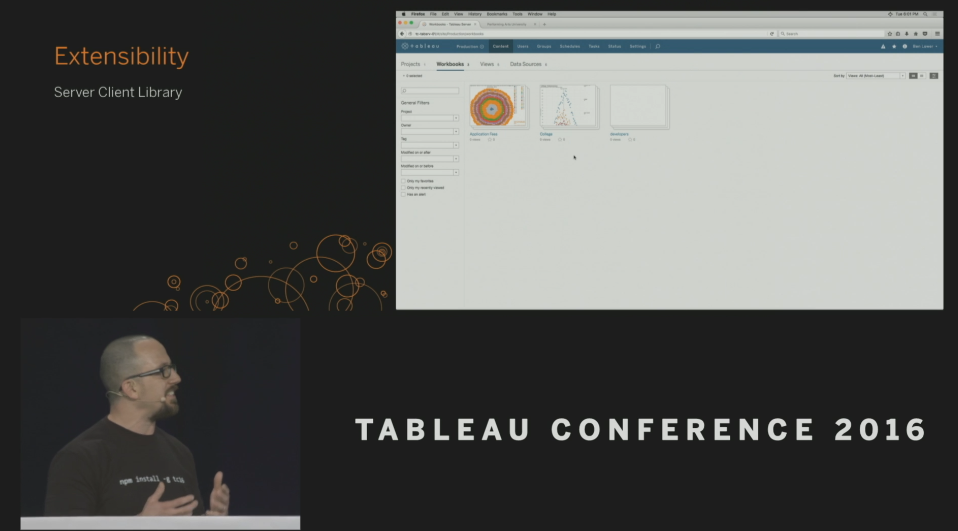
Above: A look at the new Server Client Library.
HTML embedding has been available for a long time on Tableau Server, but Ben Lower showed lots of enhancements through the REST API. First up, High Resolution Images are now available, making your dashboards look as nice as possible within your own website. Next, he showed how JSON and CORS Support will allow deep integration into your website all in fully client-side code. This will mean that you’ll be able to keep things like favorites on Tableau Server reflected within your web portal, as well. Ben also showed off the getData function, which InterWorks has already dug into if you want to know more.
The Web Data Connector has allowed for a lot of cool new connection possibilities and naturally InterWorks has had a lot of fun exploiting them. One limitation, though, was that you could only surface one table at a time. With Multi-Table Support, you’ll be able to provide a fuller and more flexible data source to your users.
The final demo Ben shared was an exciting one. Mobile App Bootstrap is going to make it easier then ever to get started making your own mobile apps, fully integrated with Tableau. There are many things that can hard to manage in an app, such as user authentication, and Mobile App Bootstrap will help ease implementation. This will allow developers to create great, integrated Tableau experience in your apps.
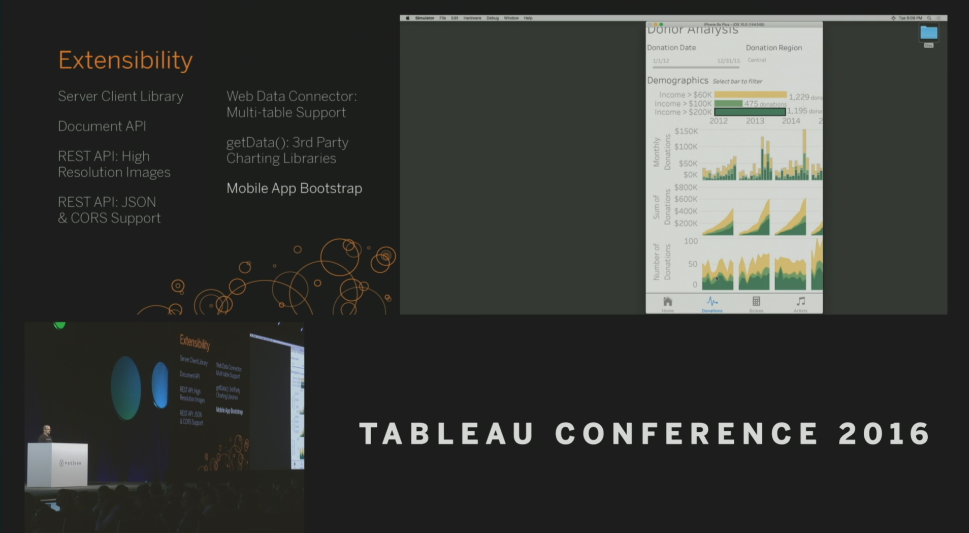
Above: Mobile App Bootstrap allows for unprecedented integration with Tableau.
Let’s Talk!
Want to know more about how these new features or existing features in Tableau can impact your organization? Let’s talk it out.