
In most Tableau training sessions, we want to use large datasets to provide meaningful insights. It can be hard, however, to get a large dataset, as per our requirements. How about generating billions of rows of dataset in a few hours? I used Python script to generate random data and load into EXASOL.
Pre-requisite
- Download EXASOL MSI client, ODBC driver and SDK from here. Make sure you download 64 bit. https://www.exasol.com/portal/display/DOWNLOAD/6.0
- After installing EXASOL, log in with your username and password.
- Download and install Python (preferably version 2.7, 64 bit) from here: https://www.continuum.io/downloads#windows
- Download PIP from here: https://pip.pypa.io/en/stable/installing/
- Open command prompt and navigate to the directory where SDK and ODBC files are located.
- Run the below commands to connect to the EXASOL server.
python setup.py install

pip install pyodbc

python exasol.py
- Create a table in EXASOL according to the requirements before running the Python code.
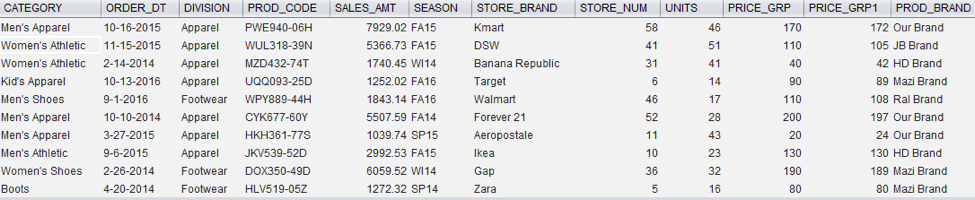
create table RETAIL.marketshare

(category varchar (30),

order_dt varchar (30),

division varchar (30),

prod_code varchar (30),

sales_amt decimal (12,2),

season varchar (5),

store_brand varchar (30),

prod_brand varchar (30),

store_num int,

units int,

price_grp int,

price_grp1 int,

primary key (prod_code, store_num, store_brand, dt));
How It’s Done
Import packages necessary for the program. In this code, I use imports EXASOL, Random, String, Pandas and Numpy.
import exasol

import random

import string

import pandas as pd

import numpy as np
Set a random seed with any number. This helps to generate data in the given probability every time you run the same code. I am specifying the number of rows to be generated with the help of variable “num” and initializing all the variables used in this program.
np.random.seed(123)

num=100000000

sales_amt= []

prod_code= []

date= []

season_1= []

season= []

price1= []

rem= []

price_grp= []

price_grp1= []
I want units and price to be a random integer, for which I have given a range.
units=[random.randint(1,51) for x in range(num)]

price=[round(random.uniform(20,200),2) for X in range(num)]
Store brand, product brand, division and category is randomly generated from the given array. Here I want to generate data non-uniformly, hence giving probabilities for each item in the array. Please note that by default, it generates data uniformly. Then, we will not get variations in graphs in Tableau.
store_brand= ["TJ Max", "JC Penny", "H&M", "American Eagle", "Old Navy", "DSW", "Simon", "Macys", "Sears", "Kmart", "Walmart", "Aeropostale", "Banana Republic", "Dillard's", "Forever 21", "Gap", "Ikea", "Costco", "Target", "Zara", "Dillards"]

store_brand=np.random.choice(store_brand,num,p=[0.18,0.11,0.06,0.12,0.10,0.08,0.07,0.05,0.03,0.02,0.02,0.02,0.03,0.01,0.01,0.01,0.02,0.02,0.01,0.01,0.02])

prod_brand= ['Our Brand', 'CKC Brand', 'Jez Brand', 'Ral Brand', 'Mazi Brand', 'Zakka Brand', 'JB Brand']

prod_brand= np.random.choice(prod_brand,num,p=[0.30,0.13,0.18,0.15,0.05,0.08,0.11])

store_num=[random.randint (1,101) for x in range(num)]

division=["Footwear","Apparel","Equipment"]

division= np.random.choice(division, num, p=[0.30,0.55,0.15])

category= ["Women's Athletic","Men's Athletic","Sleepwear","Women's Apparel","Men's Apparel","Kid's Apparel","Women's Shoes", "Boots", "Men's Shoes", "Outdoor Equipments", "Indoor Equipments"]

category= np.random.choice(category,num,p=[0.10,0.14,0.06,0.22,0.15,0.13,0.08,0.06,0.03,0.02,0.01])
I want product code to be in a certain format with mixed characters and letters.
prod_cd1=[random.choice(string.ascii_uppercase) for X in range(num)]

prod_cd2=[random.choice(string.ascii_uppercase) for X in range(num)]

prod_cd3=[random.choice(string.ascii_uppercase) for X in range(num)]

prod_cd4=[random.randint(0,9) for X in range(num)]

prod_cd5=[random.randint(0,9) for X in range(num)]

prod_cd6=[random.randint(0,9) for X in range(num)]

prod_cd7=[random.randint(0,9) for X in range(num)]

prod_cd8=[random.randint(0,9) for X in range(num)]

prod_cd9=[random.choice(string.ascii_uppercase) for X in range(num)]

for i in range(0,len(prod_cd1)):    prod_code.append(prod_cd1[i]+prod_cd2[i]+prod_cd3[i]+str(prod_cd4[i])+str(prod_cd5[i])+str(prod_cd6[i])+"-"+str(prod_cd7[i])+str(prod_cd8[i])+prod_cd9[i])
Season should be based on the date and then split into Summer, Fall, Winter and Spring. I would also like to show more sales during the holiday season.
year=[random.choice(range(2014,2017)) for X in range(num)]

m=[1,2,3,4,5,6,7,8,9,10,11,12]

month=np.random.choice(m,num,p=[0.14,0.10,0.06,0.01,0.01,0.13,0.08,0.06,0.03,0.02,0.14,0.22])

day=[random.choice(range(1,28)) for X in range(num)]

for j in range(0,len(prod_cd1)):

    date.append(str(month[j]).zfill(2)+"-"+str(day[j]).zfill(2)+"-"+str(year[j]))

    if 3 <= month[j] <= 5:

        season_1.append("SP")

    elif 6 <= month[j] <= 8:

        season_1.append("SU")

    elif 9 <= month[j] <= 11:

        season_1.append("FA")

    else:

        season_1.append("WI")

    season.append(season_1[j]+str(str(year[j])[2:]))

for l in range(0,len(units)):

    if season[l]=="WI":

        units.append(units[l]*10)

    else:

        units.append(units[l])
Now I am calculating sales amount based on the units and unit price. The price has been bucketed to two groups – price rounded to 10’s in one group and price rounded to 1’s in the other group.
for k in range(0,len(price)):

    sales_amt.append(units[k]*price[k])

for y in range(0,len(price)):

    price1.append(sales_amt[y]/units[y])

    rem.append(price1[y] % 10)

    price_grp1.append(int(round(price1[y])))

    if rem[y] < 5:

        price_grp.append(int(price1[y] / 10) * 10)

    else:

        price_grp.append(int((price1[y] + 10) / 10) * 10)
Once all the logic is written, all I do is put it in Panda's data frame.
df=pd.DataFrame({'store_brand': store_brand[0:num],'store_num': store_num[0:num],'division': division[0:num],'category': category[0:num],'prod_code': prod_code[0:num],'date': date[0:num],'season': season[0:num],'units': units[0:num],'sales_amt': sales_amt[0:num],

'price_grp': price_grp[0:num], 'price_grp1': price_grp1[0:num], 'prod_brand': prod_brand[0:num]})
Connect to EXASOL using exasol.connect in the Python script. Be sure to specify driver name, server details, login credentials and table name.
df=pd.DataFrame({'store_brand': store_brand[0:num],'store_num': store_num[0:num],'division': division[0:num],'category': category[0:num],'prod_code': prod_code[0:num],'date': date[0:num],'season': season[0:num],'units': units[0:num],'sales_amt': sales_amt[0:num],

'price_grp': price_grp[0:num], 'price_grp1': price_grp1[0:num], 'prod_brand': prod_brand[0:num]})
End Product
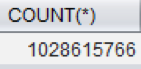
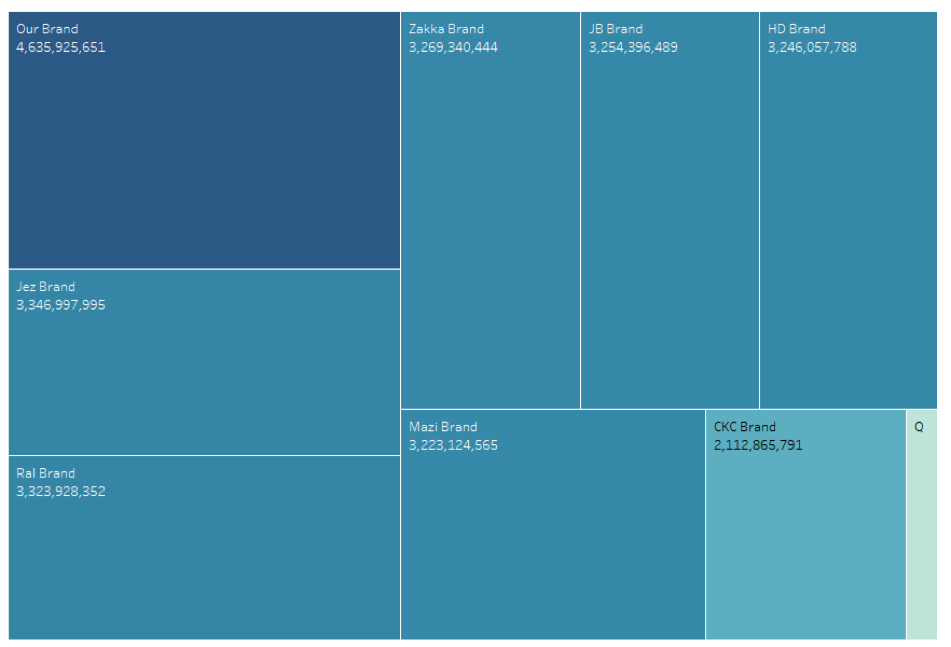
It took me about 15 seconds to load one billion rows of data from EXASOL into Tableau and generate the tree map for product brand.