
Wondering about how to use data from EXASOL in analytical tools? EXASOL integrates with most analytical tools. Below is an example of how to connect to EXASOL from R and create a beautiful cluster plot.
In this example, I used JDBC which is an interface used by Java applications to access databases. You are required to install the Java package or set the environment path if already installed. After making the connection to EXASOL, you can query the database from R and use the data for analytics. For R developers, this should be straightforward and expose many new possibilities for large-scale analytics.
To start, we need to install a few packages in R to connect with EXASOL. For this, we need RJDBC, DBI and rJava libraries. Java should be compatible with EXASOL upon installation. For example, if the EXASOL driver is 32-bit, then the Java should also be 32-bit. On the other hand, if the EXASOL driver is 64-bit, then the Java should also be 64-bit.
install.packages("rJava")

Sys.setenv(JAVA_HOME='C:Program Files (x86)Javajre7')

library(rJava)

install.packages("RJDBC", dep=TRUE, repos="http://star-www.st-andrews.ac.uk/cran")

install.packages("DBI")

library(DBI)

library(RJDBC)
Specify the local path in which the jar file is placed. Now, you are all set to connect to EXASOL by giving your login credentials.
drv <- JDBC("com.exasol.jdbc.EXADriver", "C:/Program Files (x86)/EXASOL/EXASolution-6.0/EXAplus/exajdbc.jar")

conn <- dbConnect(drv,"jdbc:exa:127.0.0.1","username","password")
In this example, I am trying to form clusters of similar places in New York City based on the area and length of a side for a particular borough. For this, I must pull the necessary data from my tables in EXASOL.
myquery <- "select boroname, nvl(shape_leng,0) length, nvl(shape_area,0) area from nyc_taxi_production.nyct2010;"
Once the data is ready to use in R, we can use k-means clustering technique to achieve the objective. I am specifying the variables to be used by giving the subscripts. I’m also specifying the number of clusters to be five. In k-means technique, you should specify the number of clusters, unlike other clustering techniques. You can also find out the optimal number of clusters for the dataset using “NbClust”. Here, I chose to go with a standard number of clusters.
stats <- dbGetQuery(conn, myquery)

km <- kmeans(stats[c(2,3)],5)
To visually represent the clusters created using k-means, we can use the function “fviz_cluster.” To use fviz, we need to install the facto extra package as shown below.
install.packages("factoextra")
library(factoextra)
plot(stats[c(2,3)])
text(stats[c(2,3)],labels=stats$BORONAME,col=km$cluster)
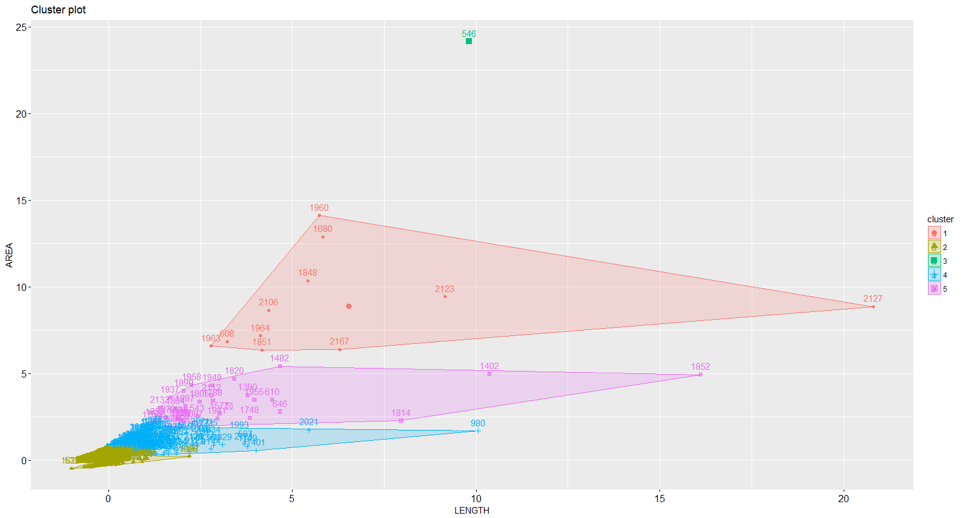
fviz_cluster(km,data=stats[c(2,3)])
From the plot, we can see that five clusters are created. Looks like we have an outlier that is placed in Cluster 3.
Of all the analytic methods that I learned in school, clustering or market segmentation analysis is my favorite. This explains why I use clustering to illustrate.
The main point of this example is to explain how you can retrieve data from EXASOL and use the data outside for analytics. There are numerous ways to retrieve data from EXASOL. You can also retrieve data using ODBC if you face problems with installing Java. Stay tuned for my next blog which will explain how to retrieve data from EXASOL using ODBC!