
BI Crossroads and the Current State of the Industry
For years, the business intelligence (BI) industry has promised self-service analytics, democratized insights and agile decision-making. But most organizations are still stuck in the same old loop: open the dashboard, export to Excel, clean, combine, rebuild and email. Despite millions in tech investment, today’s analysts still use the same habits and tendencies from decades ago.
As Mat Hughes aptly describes in this blog post, we’ve optimized BI platforms for technical capability, not for the reality of human problems and actual workflows. The result is what he calls the “Excel Export Reality:” beautiful dashboards that don’t actually help people do their jobs. Real-world analytics is messy: users struggle to find relevant dashboards, filters don’t reflect business logic, and trust in data is eroded by conflicting metrics across departments, or maybe the same metrics displaying different results due to lack of data governance.
“This isn’t a tool problem. It’s a paradigm problem. Sigma isn’t just another tool—it’s an answer to a different question.”
Our BI Tool Evaluation Approach
This blog will outline some comparisons between the two biggest legacy tools (Tableau and Power BI) and Sigma, an up-and-coming new tool we have significant interest in. This week in fact, Sigma was just included for the first year on Gartner’s Analytics and BI Magic Quadrant list! While this does help show larger growth and awareness across the industry, their tool comparison succumbs to the bias of preferring the incumbent tools and being slow to react to genuine new challengers.
We have our own distinct thoughts. Personally, I value Sigma as a tool as higher on both the “Completeness of Vision” and “Ability to Execute” axes. Thus, I wanted to make a comparison framework for helping you choose a tool for what makes sense for you based on our prior client implementations and analytics practice experience.
When we conduct tool evaluations, we evaluate across different capabilities, including:
- Core data prep and modeling capabilities
- Analytics use cases
- Dev experience and flexibility
- Distribution and embedding
- Roadmap, support and business alignment
Rather than advocating for one solution, this guide helps organizations navigate trade-offs and decision frameworks based on their strategic priorities.

Functionality Comparisons
Data Interface
Data Connections
In terms of cloud availability and data connectivity, Sigma connects to all major cloud providers including Amazon Web Services, Google Cloud Platform and Microsoft Azure. In addition, it connects to all major cloud data warehouses like Snowflake and Databricks, while also having some connections to traditional servers, though there are some potential limitations in using non-cloud data connections.
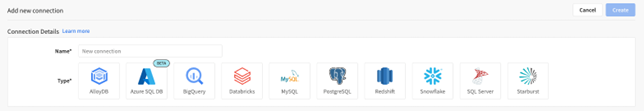
Sigma Data Connections menu.
Sourced from in Sigma environment.
Tableau Server can be deployed on-prem or on cloud platforms as well through AWS, Azure or GCP. There is a recent push to migrate to Tableau Cloud (Salesforce’s cloud-based solution), though it is exclusively hosted on AWS and organizations may face maintenance challenges. Power BI is fundamentally a cloud-based solution with its core service being Power BI Service hosted on Microsoft Azure.
Sigma is built for the cloud, end to end. Legacy tools like Tableau and Power BI, on the other hand, are retrofitted tools that began with on-premises development. Tableau and Power BI introduced “data extracts” as a concept where a user can subset a dataset and save it separately, instead of working with the original live data connection. While this helps performance pitfalls, it ends up causing challenges like stale/duplicated data, long queues and security threats.
Using extracts is great for development and for use cases where data only needs to be refreshed at a certain cadence. In this way, you are not continuously pulling live queries, saving potential costs and compute, though these extract refreshes must be scheduled through the cloud/server and be a published report. Any local report with an extract runs into the decentralized data governance problem.

Tableau data extracts flowchart.
Source: Tableau blog.
Both Tableau and Power BI offer extensive lists of data connectors. As mentioned above with extracts, legacy tools work best with non-live connections, such as Power BI working best in import mode due to increased performance capabilities and expanded DAX function options. Using Power Query to shape your data in Power BI is possible when connected to data via DirectQuery, but the possible transformations are limited.
Data Modeling/Prep
Think of Sigma as a tool that packages Tableau Prep + Tableau Desktop + Spreadsheet Modeling + Drag-and-Drop Analytical Data Visualization creation all packaged into one tool. Sigma has been rapidly evolving their data modeling capabilities and provides intuitive ways to conduct data prep on tables to create shareable data assets. Utilizing scheduled materialization and warehouse views, Sigma leverages CDW capabilities and aren’t tied to one specific tool. In addition, Sigma also provides lookups, which offer more flexibility than traditional joins.
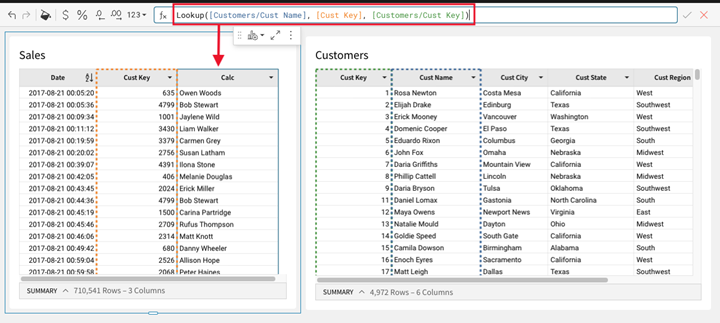
Sigma’s lookup functionality.
Source: Sigma documentation.
In the same vein, Tableau and Power BI also provide wide arrays of data modeling features, allowing users to typically get their intended goal. However, Tableau Desktop offers native “Blends” and “Relationships” (“meatballs and noodles” anyone?). For more advanced use cases, a separate tool – Tableau Prep Builder – can be used; however, a separate Data Management Add-On is required to schedule workflows, and the tool can’t leverage live connections through prep. You must schedule workflow refreshes.
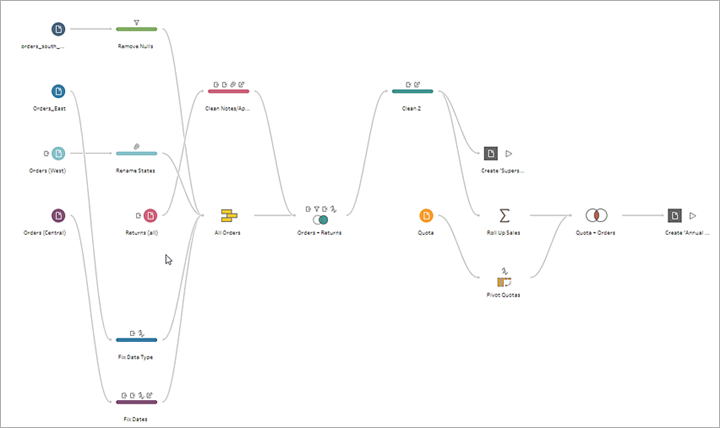
Tableau Prep workflow.
Source: Tableau documentation.
Power BI’s in-tool data transformation solution, Power Query, allows for more extensive transformation and are very powerful, particularly when creating data models. Much stronger than Tableau Desktop on its own, Power BI is super capable, however errors in model configuration cause DAX to not work properly as intended in some cases.
Data Quality and Lineage
For confirming the accuracy and reliability of data sources, Sigma integrates with metadata tools such as Atlan, Alation, Castor, etc. Additionally, Sigma directly offers a reusable semantic layer, metrics, a lineage view and the ability to navigate from any Sigma object to the source table.
Sigma data lineage view.
Source: Sigma product FAQ.
After recognizing the need, Tableau introduced the Data Management Add-On. While this tool does offer some visibility into metadata, it doesn’t solve one of their main issues that many face — the sprawl of thousands of reports and hundreds of data sources. Administrators can’t restrict what data can be published by who, and creators can get around warehouse security but using local extracts, which further feeds the duplication of data. Once again, there is no single source of truth and potentially conflicting insights.
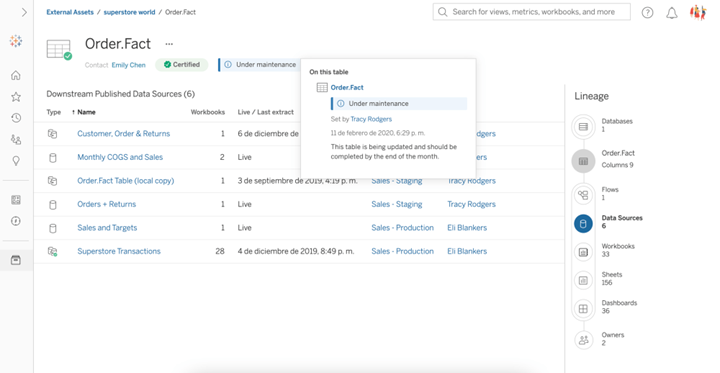
Tableau Data Management Add-on.
Source: Tableau Data Management Add-on page.
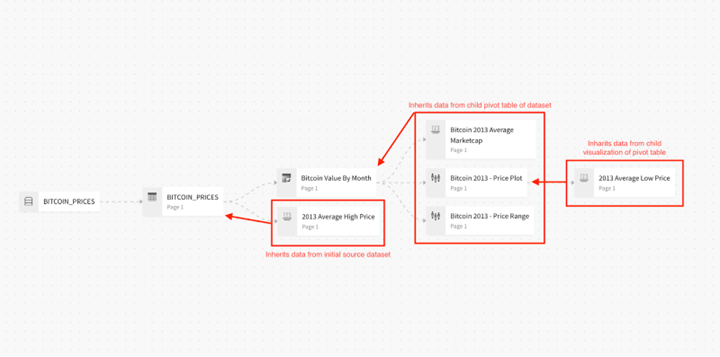
Tableau has Limited Data Lineage tracking, with external tools like Catalog improving capabilities but at added cost, while Power BI provides impact analysis and lineage views across workspaces. Sigma has auto version history and object lineage, which is useful for tracking dependency tracking and has built it audit logs. In addition, it is very helpful for transparency and allowing users to see how varying elements within the workbook are related through source data, parent/child relationships, which lets user have trust in the data and build what and where they want!
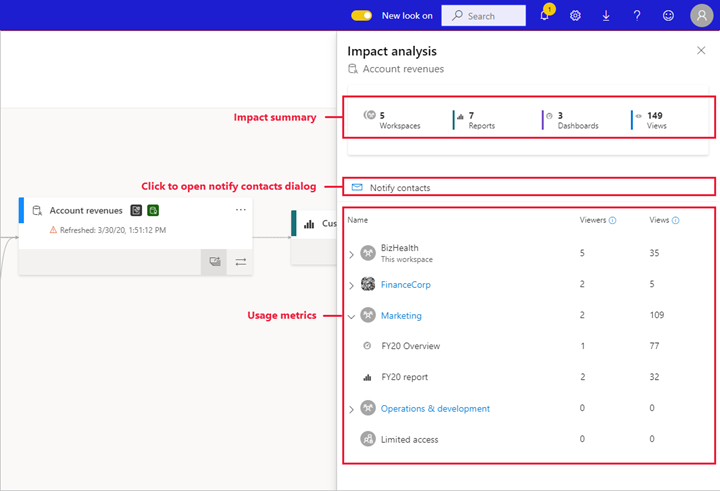
Power BI Impact Analysis view.
Source: Learn Microsoft Power BI.
Data Freshness and Governance
Sigma connects directly to cloud data warehouses and always queries live data—no extracts, no staleness. Governance is handled at the source via warehouse policies, which means less duplication and better compliance.
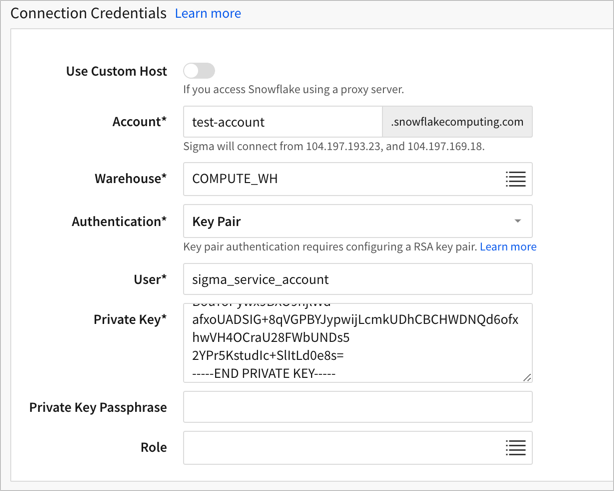
Sigma connection to Snowflake.
Source: Sigma documentation.
By using local extracts in Tableau and Power BI, you risk data misalignment and stale logic. Tableau’s governance features are also locked behind additional licensing (e.g., Data Management Add-On).
“You can’t build a data-driven culture on a foundation of data distrust.”
Tableau does have a version of semantic layers with their Published Data Sources. However, the data modeling capabilities disappear when using these. Whenever using local files or typical data connections, the datasets are decentralized due to workbook level logic, timing of extract generation, etc. To their credit Tableau Catalog and Data Management Add-On can help but require additional licensing add-ons.
Power BI datasets have governance with workspace roles, deployment pipelines, labels and also have strong RLS and usage monitoring. Sigma is warehouse first, so permissions are inherited from CDW or can be created in Sigma. Query history, audit logging and version control (like Git) are native to Sigma and viewed by admins. Sigma has modeling in warehouse or within Sigma using datasets for semantic models or workbook independent spreadsheet logic
Analytics Use Cases
Decision Support Tools
Tableau is the gold standard for customizable visualization options, allowing personalization and pixel level accuracy. However, some common visualizations like KPI cards, time period % change calculations and more require multiple levels of complex formulas, when you would assume these features should come out of the box. I will say that Tableau’s mapping and geospatial capabilities for multiple layers remains unique and a value-add distinction of the tool.
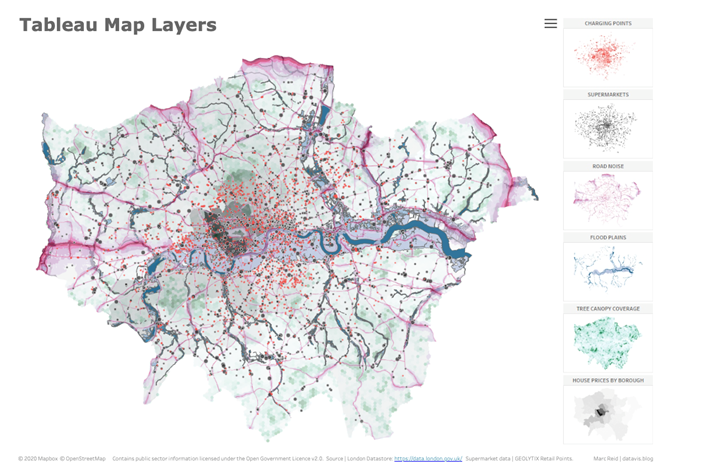
A great example of map layers in Tableau.
Source: Marc Reid on Tableau Public.
While Tableau does have “Show Me” features for building charts, you build from the ground up for the most part, requiring some technical knowledge of how the tool thinks and what it expects and is needed to achieve the intended result. Power BI has numerous frameworks for most common data visualizations, which lets you not start from scratch for each element. This advantage is quicker building, while a disadvantage is that super complex or non-out-of-box visualization types require custom extensions.
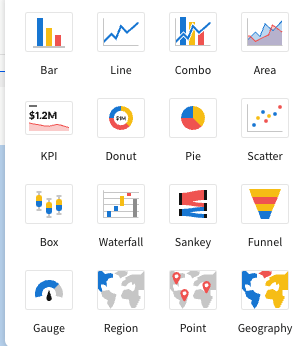
Power BI default visualizations.
Sourced from the Power BI environment.
Sigma works similarly to Power BI in the sense that it speeds up the viz creation process by having prebuilt processes for selection of popular visualization types. While Sigma covers pretty much all common use cases, I will say the viz creation capabilities are lesser than the flexibility of the other tools, as it also emphasizes tabular exploration. However, they are rapidly adding options, and users can create custom plugins as well (similar to other legacy tools). Tableau and Power BI distinguish here as advanced descriptive analytics, though Sigma has the following strengths of being an interactive decision app.
Sigma default visualization.
Sourced from the Sigma environment.
Self-Service Analytics and Data Apps
In the last wave of BI tools, the key promise was full self-serve analytics and empowering business users to find their own solutions and alleviate the burden on traditional analytical or IT teams. However, in reality, these dashboarding/report building projects require technical experts with the skill of translating design and decision requirements from business users. This often results in technical debt and weeks of effort just to answer potential ad hoc questions. Even when that report is published, the user consuming the report may not have the ability to drill down into context or view the underlying data or queries powering the analytical dashboards.
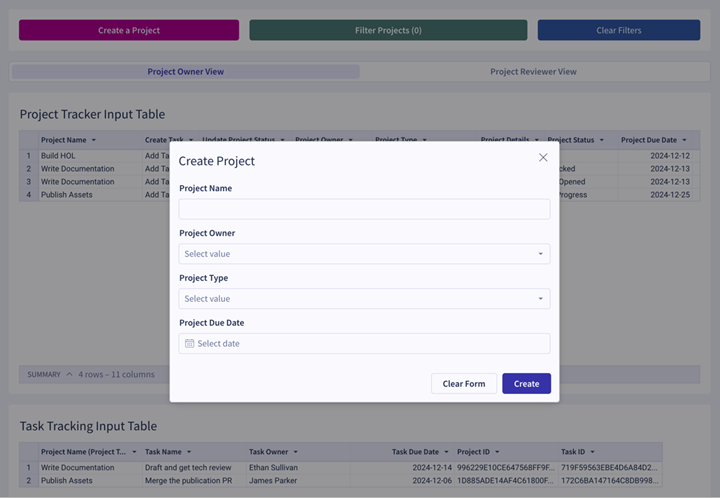
The value of Sigma lies in the introduction of analytical workbooks that blend ad hoc data exploration with creation of reports. Sigma uniquely supports data write-backs to the warehouse through input tables, which allows teams to run what-if analyses, adjust forecasts or flag exceptions right from the tool. This functionality is limited in Tableau, while Power BI relies on the Power Apps integrations and Power Apps visualizations to leverage these capabilities. Importantly, Sigma does not overwrite source or production data (for obvious security reasons), and the tool writes back to a designated schema and database in the CDW.
Drill paths in Sigma are intuitive and contextual. Tableau can rely on multiple dashboards or filters to offer similar capability, while in Power BI, good data modeling is required and can be slightly clunky on the UI side. In Sigma, a user can select any dimension to drill down into, which helps an end user answer flexible ad-hoc questions without requiring whole new reports or custom pre-built options.
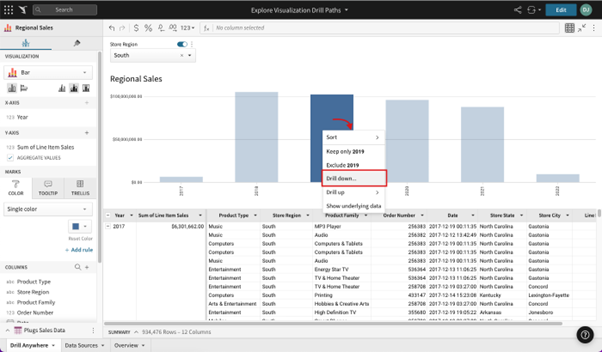
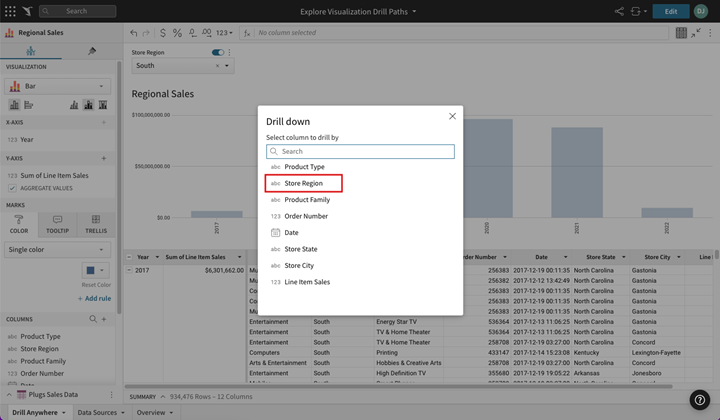
Sigma drill down functionality.
Source: Sigma documentation.
Developer Experience
Coding Requirements
Sigma mimics a spreadsheet interface and uses syntax similar to Excel formulas, reducing the barrier to entry for any Excel-savvy user. Users can create, filter, calculate, and drill down without writing complex syntax. Sigma is very “what you see is what you get” in a positive way. Some other tools are designed for builders, but primary users can be anyone. This chasm between some creators and consumers can lead to issues, whereas Sigma benefits of effectively having a spreadsheet on top of SQL, which makes it more accessible and understandable for general business users. With over 200 default functions, users have numerous out of the box options, with additional capabilities for Custom and User Defined Functions as well. One note of value is the out-of-the-box KPI charts, period/time analysis and numerous other capabilities that are possible but require multiple steps and calculations in Tableau.
In Tableau, experts like those at InterWorks are able to come up with creative solutions to stretch the boundaries of the tool’s capabilities. While neat and a defining value proposition, the common man faces a steep learning curve to overcome the technical moat. It requires a solid understanding of visual layers and Level of Detail (LoD) calculations, while Power BI users have to learn DAX and M – two separate programming languages – to optimize their experience and power with the tool.
Since Sigma is super intuitive to onboard into and easy to learn, this minimal training requirement allows massive financial savings as well. Users don’t have to learn new coding syntax and can expect to have a reduction in indirect platform expenses that typically come with advanced user training, enablement, and developmental resources.
I like the analogy by Katrina Menne that Tableau typically starts top-level granularity and uses LOD to work your way down (drill down authoring). Sigma starts row-level and groups on the way up, which is more flexible, though there are certainly some scenarios where Tableau LODs are still intuitive. Drill up authoring makes your mistakes more apparent early on, as you can see aggregation errors without having to drag extra dimensions into the view to troubleshoot. I will say that LOD’s can be a bit black-boxy and confusing for non-technical audiences. While super powerful, not being intuitive to users and having the inability to see data in the flow of work is a limitation of Tableau.
Layout Development
Sigma operates on a grid layout system for page organization, which allows easy element positioning for order and hierarchy. These features are key to design best practices (which InterWorks specializes in for top-level analytical solutions and dashboard!). While it is possible to achieve pixel-level detail in Tableau or Power BI, having to deal with floating visuals or complicated containers can be more of a headache and learning curve as well.
I will say that for expert Tableau users used to advanced pixel level detail and layering of multiple floating objects (think partial transparency), these features are not yet possible in Sigma, though having the grid layout system suits almost 99% of use cases for traditional reports or dashboarding. If you require custom backgrounds or layered images, you could always use a third-party tool like Figma or PowerPoint and import as an image into Sigma.
Sigma stands out in the abilities to create data apps through modals, workflows with triggered and sequenced actions, etc. Doing this requires way more work in legacy tools, reinforcing the notion that Sigma goes beyond traditional dashboards that provide insights, it serves as an analytical hub for insights, collaboration, decision making and planning.
Sigma modal functionality.
Source: Sigma documentation.
Theming and Customization
Sigma supports org-wide workbook themes, color templates and layout defaults, which are essential for embedded analytics and that unified experience we talked about. Tableau and Power BI offer limited template enforcement, often relying on manual reuse or the creation of a sample dummy workbook for analysts or developers to use as a starting point, and there is no way to deploy org-wide fonts and color schemes, a nice feature of Sigma for customized style guides. Power BI does have pre-built templates or allows for JSON advanced theming, whereas Tableau requires custom preferences files for color palettes and is a bit of a pain since it is done locally on a user level (though this was announced at the recent Tableau Conference to be changing in an upcoming update).
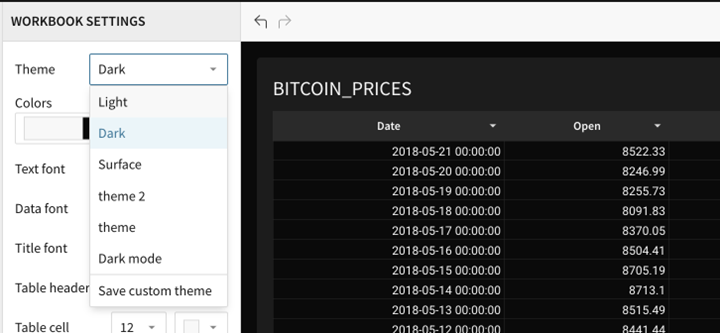
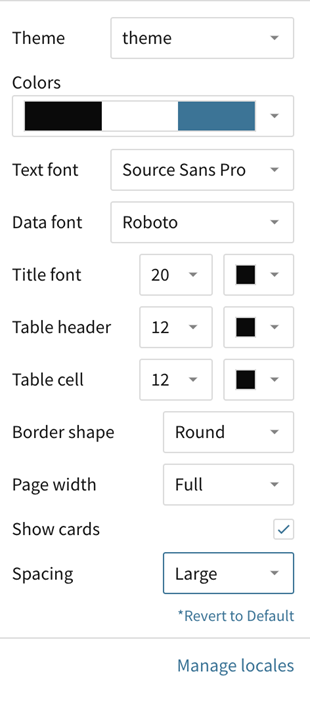
Sigma customization for embedded analytics.
Source: Sigma product FAQ.
Collaboration and Version Control
Sigma enables Google Docs-style real-time editing, commenting and version control directly within workbooks. Users can enhance communication between team members by adding comments to workbooks or specific elements, providing context, seeking feedback or making requests to iterate on. Creators and Admins can capture images of workbook elements, annotate them and save them with comments for clarity as needed. These capabilities allow users to build BI use cases while answering real time questions faster (and natively).
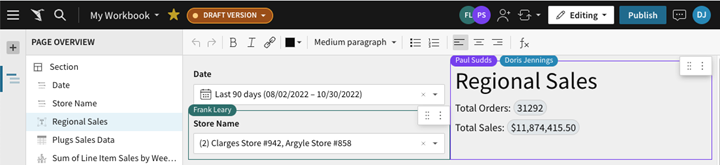
Sigma live edit collaboration
Source: Sigma documentation.
Tableau and Power BI lack real-time collaboration due to their online web edit feature limitations and do not possess the same capabilities as the local desktop version. Tableau versioning is very manual and requires multiple files for backups, where Power BI does have file-based versioning via SharePoint, but Sigma takes the cake here with co-authoring, version history and rollback functionality.
Performance
Sigma can query billions of rows in seconds by leveraging cloud data warehouse processing (like Snowflake’s MPP) to stay fast even as data scales upward. Because of this, users are empowered to continue to access and work with live data without diminishing performance or the need to extract information. Whatever your CDW compute capabilities, the power of Sigma matches.
Tableau and Power BI often rely on data extracts – allocating additional computational resources or conducting pre-aggregations upstream to stay performant – but this comes at the cost of data freshness and complexity. In Power BI, users have robust data modeling capabilities and are recommended to use STAR schema relational models. However, when having data volume of over one million rows, Direct Query suffers from a larger performance drop off and is also limited to one million rows of data in a query.
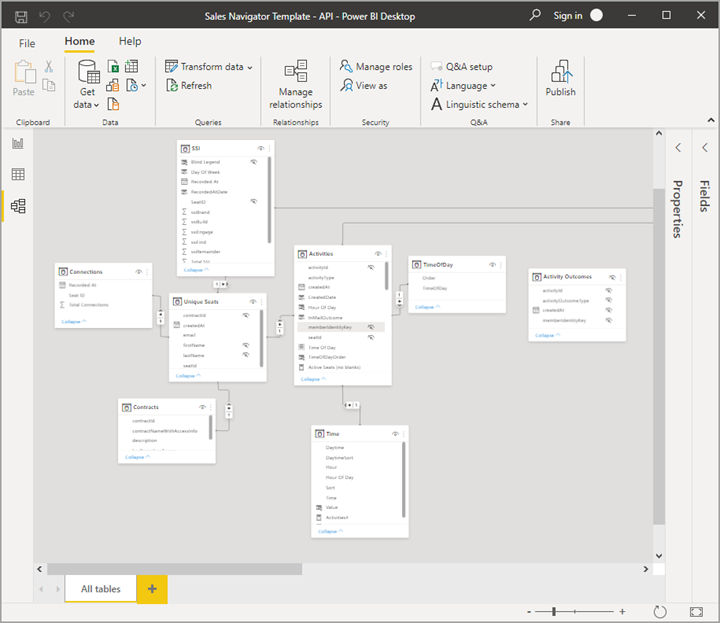
Data transformation model in Power BI.
Source: Learn Power BI.
Distribution
Ops Reporting/Subscriptions
Tableau allows user subscriptions or scheduling, while also allowing alerting for metrics using Tableau Pulse if purchased. Power BI supports subscriptions, paginated reports and Power Automate Workflows. Sigma allows scheduled report emails and exports in different formats. In all honesty, the sharing capabilities are relatively standard across the board here with marginal differences.
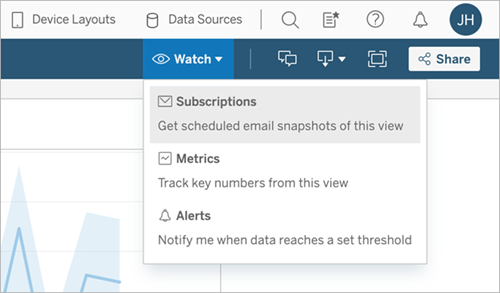
Tableau subscriptions.
Source: Tableau documentation.
Sharing and Integrations
Sigma utilizes workspaces within an environment to categorize and share through folders, documents and workbooks, while also managing access through permission grants (inherited through other tools or created natively in Sigma). While different license tiers have different capabilities, Sigma also supports deep integrations for sharing via Slack, email, Google Sheets and more — reducing data silos and keeping context embedded with the data. Export options include PDF, image, CSV and Excel. APIs can be used to export entire workbooks, pages, elements, or various data formats as well.
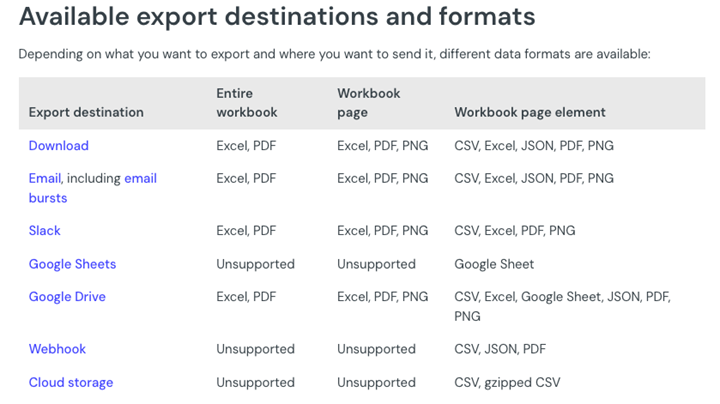
Sigma send or schedule reports view.
Source: Sigma documentation.
Tableau and Power BI both have similar and expansive sharing options, though some differences lie within the respective Salesforce/Microsoft tech stacks and may be less flexible than Sigma’s user-defined SMTP, custom “from” email addresses, predefined “reply” email addresses and the option to include custom logos.
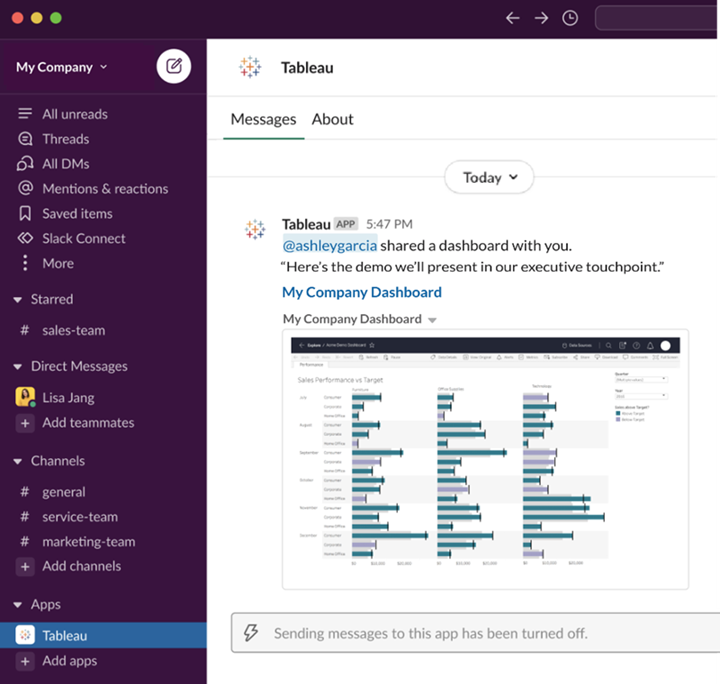
Tableau to Slack integration.
Source: Tableau documentation.
Embedding
Integrated analytics is key for elevating user experiences. The opportunity to embed these analytical tools directly into platforms or websites is key for sharing and ideally users feel like it is native functionality and separate from the medium they are using.
All three of Tableau, Power BI and Sigma support public, private and user-backed embeddings. This enables seamless integration into external-facing portals or internal tools, with row-level security and user-specific customization. Tableau and Power BI do have added strengths of embedded API frameworks.
Embedding multiple tools in the same medium can sometimes be difficult or users struggle to create a fully unified experience between tools, which is exactly why we created platforms like Curator by InterWorks that give you more control over the look and feel of your combined analytics environments.
“Don’t make people come to dashboards. Bring insights to where people work.”
Business Value + Commercial Details
Platform vs. Product Vision
As a modern, cloud-native analytical tool, Sigma is purpose-built for fast iteration, decision-making and modern BI workflows. Tableau is increasingly locked into the Salesforce ecosystem. Power BI is evolving into a complex web of Fabric, OneLake and the Power Platform. While there are certainly perks to data/tech stack integration within Salesforce or Microsoft, there are also downsides of vendor lock in and potential limited value or return on investment.
Being cloud-built helps Sigma proudly showcase scalability and performance by adjusting the computing, power and storage upstream in the CDW as demand fluctuates. This adaptability allows for efficient utilization, rather than having to increase complex on-prem capabilities. Tableau Cloud and Power BI Service have their own strengths, but they also potentially suffer from limited integrations of cloud platforms due to the parent companies.
Roadmap
Tableau and Power BI are much more mature tools, which has led to a flattening curve of new features, with the focus coming around AI integration and full data stack within their parent companies. Over the last few years, Sigma has been rapidly evolving and pushing updates that align with community feedback and innovations to align consumers, app builders and decision makers. Since the tool is cloud based, there are frequent updates, Beta features available, bug fixes-things that only come quarterly with product downloads of other tools.
Sigma’s business direction seems to be focused on positioning itself as a modern data tool for evolving BI needs around actionable insights and automated workflows, rather than just descriptive analysis or observing trends. While Sigma has also been integrating some AI features into the platform to speed up development, integrate Snowflake Cortex, etc., it seems Tableau’s recent updates have been entirely centered on AI initiatives like Pulse, SFDC Data Cloud and Tableau Next. Microsoft bets internally on Copilot and on OpenAI to help integrate a full end to end analytical and reporting stack.

Above: Tableau focusing heavily on Tableau Next at TC25 this year.
Support and SLAs
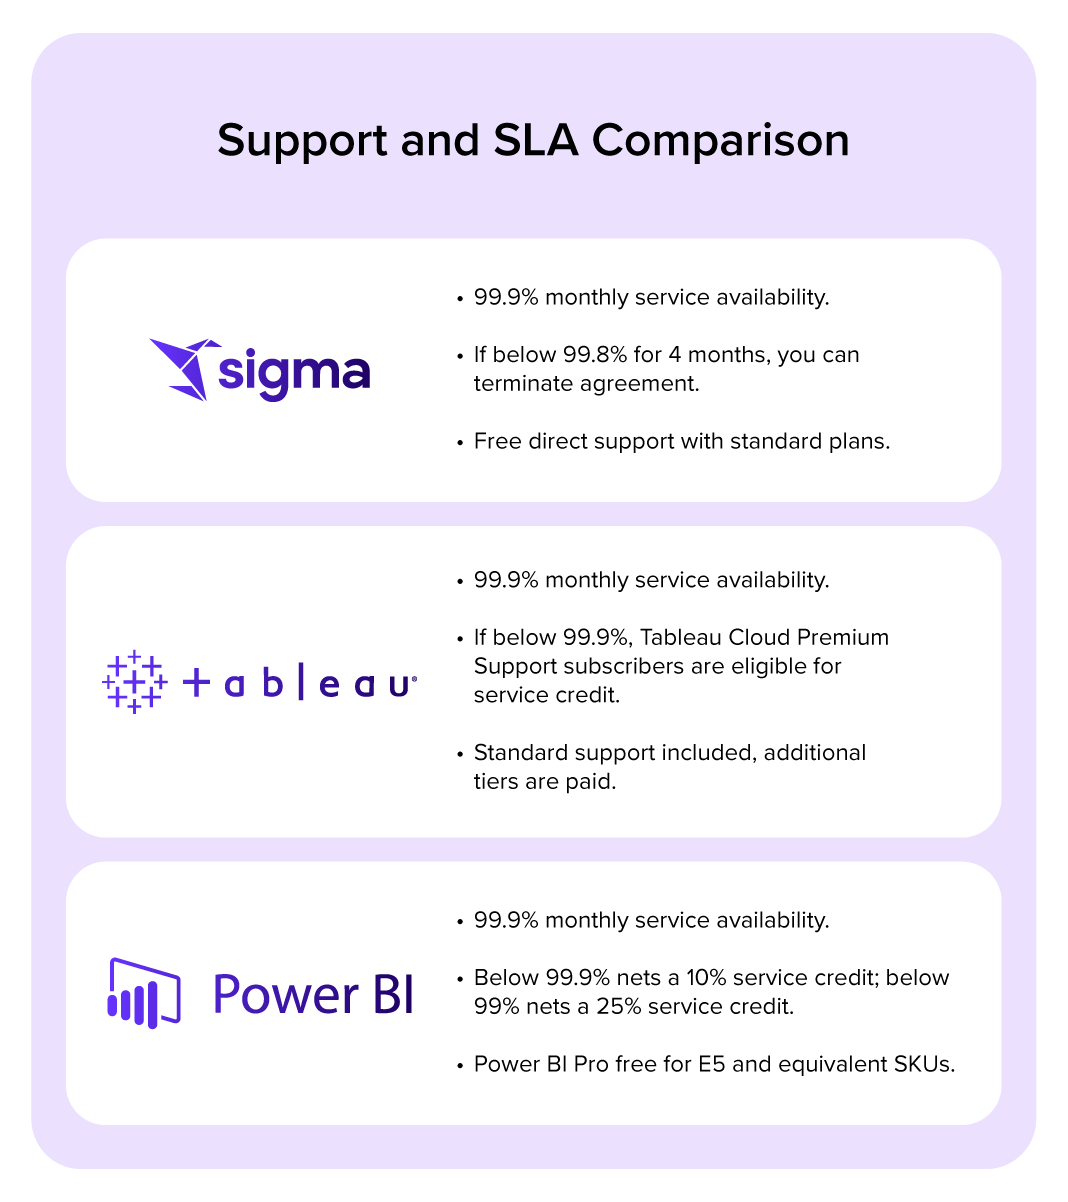
Sigma’s SLA commits to 99.9% monthly service availability, outlining a framework for managing disruptions with categorized errors and defined response and resolution times. Customers can terminate the agreement if availability falls below 99.8% for four consecutive months within a year, reinforcing Sigma’s commitment to service excellence and customer value.
Tableau Cloud offers a service level agreement (SLA) guaranteeing monthly service availability of 99.9%. If availability falls below 99.9%, only those customers subscribed to Premium Support for Tableau Cloud are eligible for an account service credit.
Power BI Pro licensing (per user) is free for Microsoft E5 and equivalent SKUs. If you don’t have Power BI Pro licenses, you are looking at least at a F64 Fabric SKU to share and view shared Power BI content.
At a high level, Tableau and Power BI have paid premium support tiers at added costs within the ecosystem. A distinguishing factor, Sigma has free direct support available with standard plans and prides itself on better and quicker support. This is possible for now with a smaller customer base than massive legacy tools and we will see how it scales, but big advantage here for now.
Licensing
While I don’t want to get into the specifics, particularly since costs tend to vary depending on each deal, I’ll note that there are free viewer roles for Sigma, charging only for those who wish to create and manage content within their organization.
Sigma offers transparent pricing: View, Act, Analyze and Build. Tableau has Creator, Explorer and Viewer roles, plus add-ons like Data Management Add-On and Advanced Management. Power BI has Free, Pro, Premium Per User and Premium Capacity — each with different feature gates.
Sigma’s low training overhead due to the intuitiveness and low barrier to entry also will likely significantly reduce onboarding costs compared to certification-heavy Tableau and Power BI environments.
Summarizing Sigma vs. Tableau vs. Power BI
BI platforms aren’t one size fits all. Though legacy incumbents like Tableau and Power BI dominate the enterprise markets, Sigma is an exciting new tool rising quickly by solving for modern problems, designed for the evolving cloud landscape.
“The analytics revolution isn’t over. It hasn’t even really started. What we’ve had so far is a dashboard revolution. Dashboards, it turns out, aren’t revolutionary at all. They’re just prettier reports.”
Organizations should evaluate their own infrastructure needs, user skill sets, budget, agility and other factors. While each tool excels in specific domains, this framework hopefully helps provide some guidance. If you’d like a more custom approach and help, we would love to do a Strategy, Vision and Roadmap session with your company!
At a high level, here are categories where the tool is a winner of the three:
- Tableau: Data visualization capabilities, ultimate design precision and customization, descriptive analytics storytelling, and a strong and expansive user support base.
- Power BI: Data modeling, governance, report sharing and integrations; lower cost if already in Microsoft stack.
- Sigma: Cloud-native architecture, data lineage, data decision apps, low barrier to entry, collaboration and version control, and full self-service exploration
Weaknesses:
- Tableau: Frequently decentralized or disparate data sources, no native writeback, pricing complexity and add-ons. While both a strength and weakness, many advanced solutions require experts or tutorials and aren’t native or intuitive.
- Power BI: Deeply tied to the Microsoft stack and also has a more advanced learning curve for calculations.
- Sigma: Has a smaller talent pool and community resources in comparison, harder to recreate advanced specific charts, mainly supports cloud data sources, not suited for orgs without Snowflake / Databricks / BigQuery / Redshift type infrastructure.
Here are some potential scenarios where each of the tools might make sense for you:
Tableau
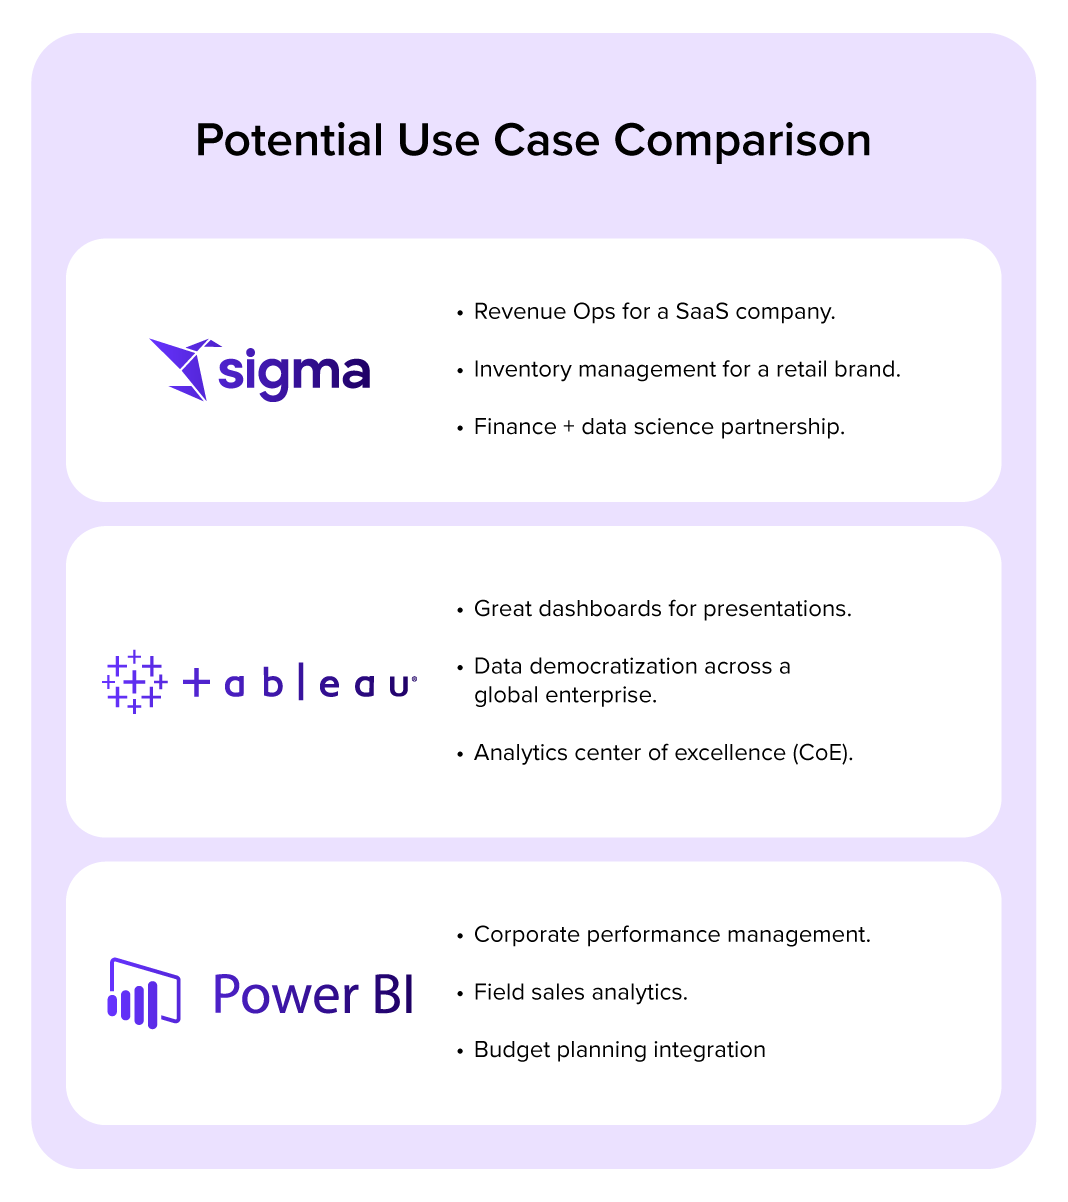
Great dashboards for presentations: A Fortune 500 financial services firm needed highly designed, pixel-perfect dashboards to share with its board. Tableau’s advanced layout controls and visual storytelling features allowed the analytics team to fine-tune branding, layout precision and custom interactivity for executive stakeholders.
Data democratization across a global enterprise: A multinational CPG company needed a tool to roll out self-serve reporting across 30+ countries with localized dashboards and strong governance. Tableau’s role-based permissions and broad cloud/on-prem deployment options enabled scalable adoption without central bottlenecks.
Analytics center of excellence (CoE): An enterprise with a dedicated BI team built a center of excellence around Tableau due to its community support, training ecosystem and extensibility via APIs. They used Tableau’s dev platform to embed and customize dashboards for internal tools while leveraging Tableau Public and Accelerators for jumpstarting adoption in new departments.
Power BI
Corporate performance management: A mid-market company with comprehensive Microsoft 365 deployment needed executive dashboards integrated with Teams and SharePoint workflows. Power BI’s native integration eliminated the need for separate authentication systems and enabled dashboard discussions within existing communication patterns.
Field sales analytics: A distribution company required mobile analytics for field sales teams who primarily worked within Microsoft Office applications. Power BI’s Office integration enabled sales representatives to access customer analytics directly within Outlook and Excel workflows they used daily.
Budget planning integration: A nonprofit organization needed to integrate budget planning with operational reporting while maintaining cost controls. Power BI’s inclusion in existing Microsoft licensing provided analytical capabilities without additional budget allocation.
Sigma
Revenue ops for SaaS company: A cloud-native SaaS company wanted to build a lightweight revenue dashboard with drill-anywhere capabilities and embedded writeback. Sigma enabled business users to directly query Snowflake data using spreadsheet logic and input variables to update forecasting models — all without engineering support.
Inventory management for retail brand: A fast-scaling DTC retail brand needed a collaborative operational dashboard that could be edited in real time by the planning, merchandising and finance teams. Sigma’s co-authoring and audit trails allowed multiple stakeholders to explore, comment, and iterate within a single worksheet directly connected to Databricks.
Finance + data science partnership: A startup’s FP&A team needed to run ad hoc analyses alongside Python data scientists using the same warehouse data. Sigma allowed them to mix SQL, spreadsheet calculations and Python cells in the same workbook, enabling collaborative modeling without handing off logic or context across tools.
Need Help Finding the Right Fit?
Of course, there are many more facets to Sigma, Tableau and Power BI that are worth exploring in greater depth before deciding which platform will be the center of your analytics environment. In truth, it’s not uncommon for many organizations to have access to more than one of these options. Each platform is capable of achieving many of the same outcomes, thought they do it in different ways or with different points of emphasis.
If you’re still considering which is the best fit and feel a bit overwhelmed by making the right choice for your organization, or even if you’re just looking to better utilize the platform you already have, our team is well versed in all three! We’d love to help.