
This blog post is Human-Centered Content: Written by humans for humans.
One of the most exciting advancements in the Snowflake ecosystem as of late is the support for Streamlit, a powerful open-source Python framework for data scientists and AI/ML engineers that allows the creation of data apps.
By combining Snowflake cloud data platform possibilities with Streamlit’s ease of use in application development, businesses can create interactive solutions without the need for complex infrastructure. This combination opens the door to new opportunities, and we’re seeing more and more companies adopting this tech stack to solve their business challenges. Some of the most common use cases that I see include:
- LLM powered apps such as AI Chat bots.
- Building visualisations using Python libraries.
- Creating user-friendly interfaces for business users to input into Snowflake workflows.
Plus, all of the above are being achieved without needing to worry about additional app runtimes, hosting, licenses or the need to create a new security model – as Snowflake Streamlit can leverage the same role-based access control that you use elsewhere in Snowflake. More on this here.
In this two-part article, I will briefly step you through a simple example to illustrate the potential of this new combo of technologies. I want to emphasise the word “simple,” because when building a basic prototype like this, you will experience one of the selling points of Snowflake Streamlit: The ease with which teams can deploy, iterate and share applications.
Above: Screenshot of a fictional EV application running in Streamlit
Use Case: Sales Tracking and Target Definition
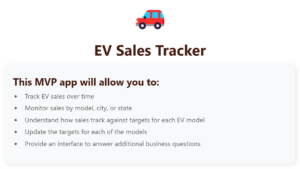
The business context for our application is simple: Commercial managers at an Electric Vehicle (EV) company want to track sales across models, cities and states in Australia. However, they also want to measure these sales against targets that they define, and that change daily. In addition, it’s important to keep a record of previous sales targets defined in order to monitor the history of these over time. To fulfill these business requirements, we’ve prepared a basic EV Sales Tracking app prototype built in Snowflake Streamlit (from now on, STR).
In the text that follows, I will outline the key components of this application, focusing on how each of them helps solving the business challenges at hand. This won’t be a line-by-line code review, but you can find the full code that I will refer to throughout the article in this Github gist here.
To follow this article you will need:
- A Snowflake account with some data in it, including databases, schemas and tables.
- ACCOUNTADMIN access to the Snowflake instance OR
- A role with either the OWNERSHIP privilege on one schema or specific privileges: USAGE on both the database and schema, along with CREATE STREAMLIT and CREATE STAGE on the schema. Additionally, you must have the USAGE privilege on at least one warehouse.
Deploying a Streamlit app
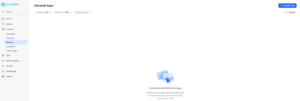
Open Snowflake in your browser and head over to the left-hand side, where you’ll find the Streamlit section. From there, click on the right to create a new Streamlit app and associate it with a database, schema and warehouse:
Once this step is complete, you’ll see a split screen: development environment on the left, app preview on the right. Let’s focus on the development side.
STR makes it really easy to get started, since:
- It gives you an app boilerplate that you can use to bootstrap your development.
- It comes with several open-source Python packages that are built and provided by Anaconda that you can use straight away inside Snowflake – at no additional cost. You can read more about it here.
To get started, I will first import several Python libraries: Streamlit itself as the framework, Pandas for data manipulation and Altair for creating visualisations. I’ll also import Snowflake Snowpark modules to define data schemas and interact with the active Snowflake session:
# Import python packages

import streamlit as st

import pandas as pd

import altair as alt

from snowflake.snowpark.types import StructType, StructField, StringType, DateType, TimestampType, IntegerType

from snowflake.snowpark.context import get_active_session
The last line of code above is relevant: “get_active_session” does a lot for you. The session context is defined by the role, warehouse, database and schema that you defined when you created the Streamlit app. So when I run this code, the Streamlit app will be able to read a star schema that I created in the same database and schema where my STR app is contained. That way, my app can easily but securely run SQL against my tables.
On that note, let’s first define a query to simply retrieve some data from my tables: I can turn the result of the below query into a Python dataframe that I can use to populate my front-end application:
def ev_transactions_query():

    # Get data from my transactions table

    data_query = """

        SELECT

            date,

            product_name AS model,

            city_name AS city,

            state_name AS state,

            SUM(sales_value) AS total_sales

        FROM ev_transactions

        GROUP BY date, product_name, city_name, state_name

        ORDER BY date

    """

    return data_query
The result of the above function can be packaged as a dataframe that I can manipulate and display it in my application. Which brings us to the next point.
Visualising Data
Most of the companies I work with use existing commercial visualisation tools to report on their data, but there are cases where using a Python library (such as Altair, Plotly or Matplotlib) may be fitting. There’s no right or wrong answer: both options come with pros and cons and, ultimately, it all depends on your circumstances.
Now I need to plot the results of my previous SQL query in the application. In this case, to build the visualisation, I use Altair, which is fairly flexible. As this is just a prototype, I am focusing on delivering a minimum viable product, so I kept design and styling to a minimum:
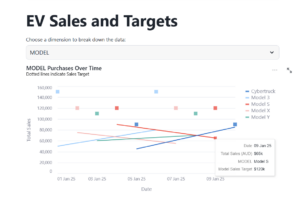
The visual above shows sales for each of my models, cities or states, depending on what I select in the dropdown. Hovering my cursor over the lines reveals a tooltip that exposes additional details about the selected data point. The squares indicate the target for each of the models. Below a boiled down version of the key elements of the visualisation.
# A dataframe containing the result of my previous query

df_transactions_data = session.sql(ev_transactions_query()).to_pandas()


# Filter and aggregate data based on user selection

grouped_data = df_transactions_data.groupby(['DATE', dropdown_option])['TOTAL_SALES'].sum().reset_index()


# Create the line chart based on a dynamic `dropdown_option`

lines = alt.Chart(grouped_data, title={

      	# .... define title and subtitle...

}).mark_line().encode(

     	#...Plot the sales values over dynamic line charts...

)


# Add another line to display the sales target for each model

target_points = alt.Chart(grouped_data).mark_square(size=100).encode(

      	#...Customise the formatting of the square markers that represent sales target...

)

points = lines.transform_filter(hover).mark_square(size=65)

tooltips = alt.Chart(grouped_data).mark_rule().encode(

      	#...Customise the formatting and contents of the tooltip...

).add_selection(hover)


 # Combine all the chart layers

 data_layer = lines + points + tooltips + target_points


# Display the chart with dynamic target lines

st.altair_chart(data_layer, use_container_width=True)
This takes cares of the visualisation requirement. With this component, the Commercial Managers can now see EV sales for the dimensions they requested. We are going to delight them a bit later by leveraging another Snowflake feature, but I’ll explore that in part two of this article.
Now we need to tackle the second requirement: allowing business users to adjust the sales targets (and keep a record of it for future use).
Business Users Interacting With Your Snowflake Flows
Subject matters experts (SME) in your company have very relevant input that is necessary for your organization and its technical workflows and automation mechanisms.
However, we can’t expect these SMEs to input their knowledge into complex workflows or ask them to do so via programming or scripting. Instead, we need user-friendly interfaces. STR is the perfect option here.
For the business case at hand, I created a basic submission form that allows Commercial Managers to submit new sales targets and see the results in the visualisation. Under the covers, we are having all these values persisted, only displaying in the application the latest submission:
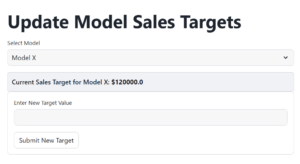
Above: Form that allows the submission of new sales targets.
Below I included a code snippet with only the bare bones of the form. I stripped its content so you can see the key components.
In essence this form allows users to select a model (e.g., “Model S”) from a dropdown list, retrieve the current sales target for that model, and display it on the interface. A field is provided to define new sales targets, which can be submitted.
# I have a dataframe named 'df_model_data'


# Create a selectbox for selecting the model (e.g., "EV Model")

model_select = st.selectbox('Select Model', df_model_data['MODEL'].tolist())


# Get the current sales target for the selected model

model_sales_target = df_model_data[df_model_data['MODEL'] == model_select]['MODEL_SALES_TARGET'].values[0]


# Display current sales target with styled markdown
st.markdown(f"""  <div> content goes here  </div> """, unsafe_allow_html=True)

# Display the form

with st.form(key='target_form'):

   	 … form contents and logic …

   	 # Submit button

    	 submit_button = st.form_submit_button(label='Submit New Target')

   	 # Process submission

    	 if submit_button:

                … submission logic and objects….

                # Write DataFrame to Snowflake table (append the new target)

                df_target_snowflake.write.mode("append").save_as_table("sales_targets", column_order="name")
Notice the last line of code above: This is how simple it is to append data to my table, as Snowflake can identify the table to write to simply with its name (“sales_targets”) as the app is aware of the tables within the schema it’s deployed in. As the sales_targets table has been designed to keep a record of all historical values submitted, we can always retrieve older values in the future should that be necessary.
Finally, to share a Streamlit app in Snowflake, simply select the app and use the “Share” option to assign roles. This allows users with specified roles to interact with the app and leverage your existing Snowflake security framework.
With this easy setup, we’ve prototyped a solution that can achieve our business objectives: allow commercial managers to track sales across several dimensions, let them quickly set new targets, and keep a historical record of all past targets, in case the company needs reporting on these figures in the long-term. And all of that without additional infrastructure, licenses, or runtimes: all straight within the Snowflake ecosystem.
You can find the full code of this application here.
In part two of this article, we’ll go further and furnish our application with an additional feature using Snowflake’s proprietary LLMs. So stay tuned!
Need help with your implementation? Get in touch!