
If you attended the latest Tableau Conference earlier this spring, or if you’ve spent any time considering the feasibility of a migration to Tableau Cloud, you may be familiar with Tableau Pulse. Tableau Pulse leverages the capabilities of Tableau AI to deliver key insights on-the-go via email or Slack on a daily, weekly or monthly cadence. Consumable 24/7 by logging into Tableau Cloud on your laptop, Tableau Pulse is also curated for mobile consumption through the Tableau app. If Tableau Pulse feels unfamiliar to you, don’t fret. Whether you’re planning for a migration to Tableau Cloud or have found your organization on Tableau Cloud, yet underutilizing Tableau Pulse, you’re in the right place.
This article will focus on our updated understanding of Tableau Pulse and its metric layer as we continue to support customers with the product. If you’re seeking Pulse basics, InterWorks has a treasure trove of articles that you can explore, ranging from what is Tableau Pulse, how to create Metrics, and how Tableau Pulse may suffice as an alternative to dashboards, which you can access here.
Tableau Pulse: A Practical Example
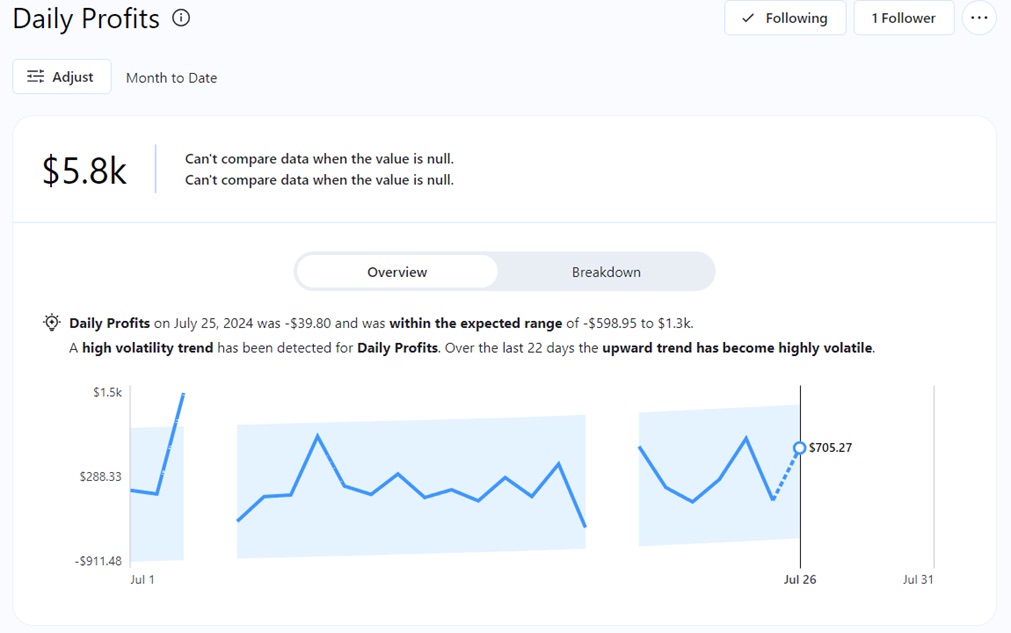
Imagine you’re an employee for one of the stores belonging to a retail chain, and you are researching efficient ways to create, display and consume your sales KPIs. For the employee who creates these KPIs, you need the process to be quick and simple. For your managers, you’d like to have a way for them to look only at certain stats and get answers on the go. For your business users or viewers, you’d like them to have a choice on how they slice a given measure to view exactly what they want. This is where Tableau Pulse comes in handy. Not only is the creation of these “metrics” simple, following key metrics feels akin to following a page on social media, with insights delivered as “digests” to your email or Slack. Alternately, Tableau Pulse metrics can be consumed via the Tableau Mobile App or by logging into the Tableau Cloud site on the web.
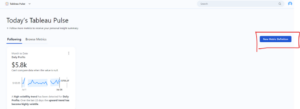
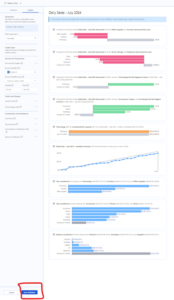
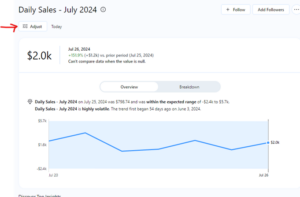
Better yet, it also shows you relevant insights before you even ask, saving you time. Look at the image below to see Pulse in action:
Worth the Hype, but How Do I Enable Tableau Pulse?
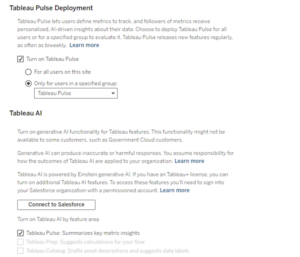
Remember, Tableau Pulse is available only on Tableau Cloud. Your organization can enable Tableau Pulse across the enterprise for all users, or simply for a specific group of Tableau users. If your company also enables Tableau AI for Pulse, it’ll facilitate the ability to summarize the insights it generates.
Once your organization makes the decision to deploy Pulse, all it takes is a simple checkbox in the Settings menu of Tableau Cloud to get started. Thanks to the rapid growth of AI and Tableau’s quick adoption, now is the right time to explore adopting Pulse if you’re already on Tableau Cloud.
For those newer to Tableau Pulse, let’s review some more key information.
Metrics vs. Definitions: How are They Different?
Before we start technically observing the difference between both these terms, let’s try to understand these terms with a simple example. Imagine you’re the sales manager of an e-commerce website and want to inspect daily sales of different products. You want a detailed breakdown across different categories and sub-categories of products that your platform offers.
In this case, once you have your data source, which is all data related to orders, you would want to observe the total sales for drilled down to whatever category or sub-category you choose. These would be termed as Metric Filters, each attribute resulting in a separate Metric. If you want your sales insights across a specific time period, you will also choose the desired timeframe.
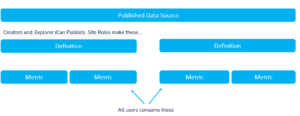
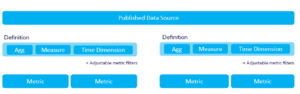
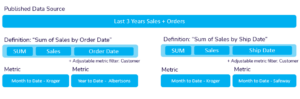
Analogous to this example, in Tableau Pulse, a published data source, any aggregations (sales, profit etc.), a specific time period and the primary filter would form the Definition, and the different insights that can be generated from this “foundation” (such as Sales by Category, Profit by Sub-Category, etc.) would form the Metrics.
Look at the diagrams below for a visual depiction of the relationship between Metrics and Definitions.
Okay, I’m Ready To Get Started, but How Do I Create a New Metric Definition?
Remember, if you want to create a new metric definition, you will need to have the right Site Role. Tableau Cloud users who are in the roles of Creator and Explorer (can publish) will have the ability to create new metrics. Contact your Site Administrator to get the necessary role assigned. From thereon, it’s as simple as choosing from a few drop-down fields.
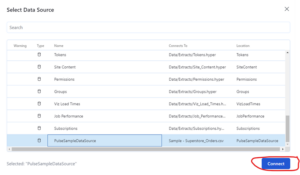
Note: You must use a published data source to create metric definitions. If you want to build your analysis upon a dataset that hasn’t been published on Tableau Cloud before, publish the data source first before getting started with Pulse.
The images below show a bird’s eye view of how to create your first metric definition:
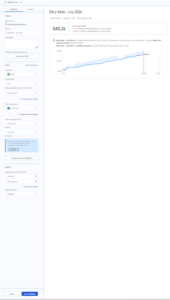
In my metric definition, I have published and chosen the Orders table of the Global Superstore dataset as my data source. The sum of sales on a daily basis is what I am interested in, so I choose the corresponding aggregate and field, after which I choose the Order Date as my time dimension. Under the Time Comparison section, you can choose the primary and secondary periods over which you want to compare your sales against the present-day stats.
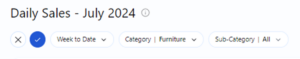
To enable a deeper breakdown into the “Daily Sales” metric definition, I have chosen Category and Sub-Category as my metric filters. This would result in different insights i.e., metrics for each filter I choose:
Under the Insights section, make sure you select the unique identifier for your dataset, which is the OrderID in this case.
Once you save your metric definition, you will be able to see the first metric:
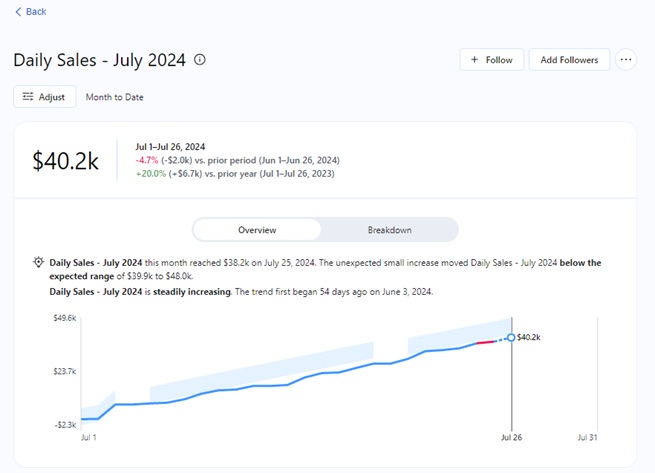

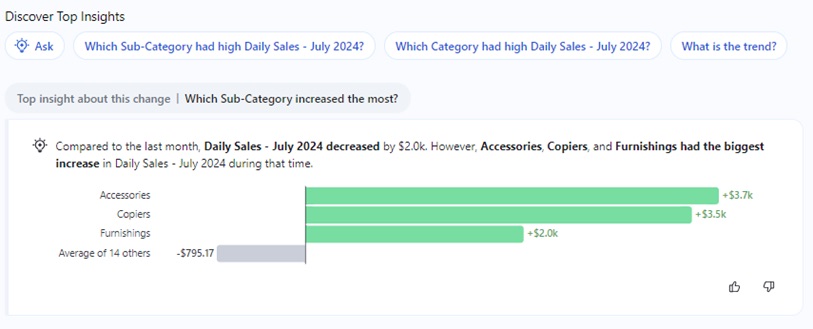
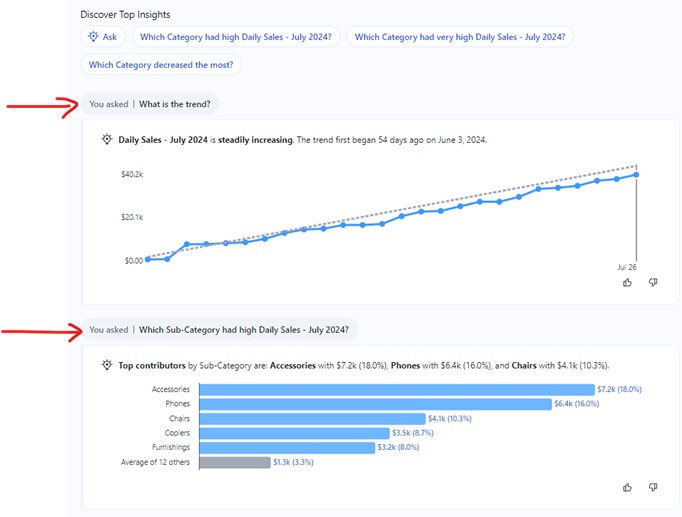
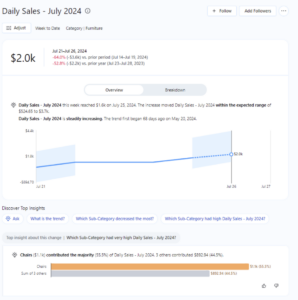
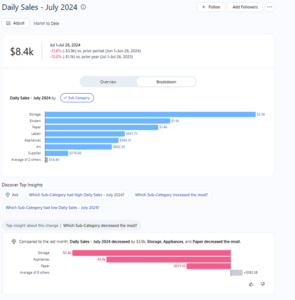
Since I also have Tableau AI enabled specially for Tableau Pulse, right below the metric, I can see my Top Insights along with the ability to ask curated questions, which Pulse will intuitively answer:
As a quick note, I also have the ability to change my timeframe and adjust my metric filters for my comparison against today’s performance:
This Sounds Fine, but What if I Want Only a Subset of My Data Without Having to Filter After Creating My Metric Definition?
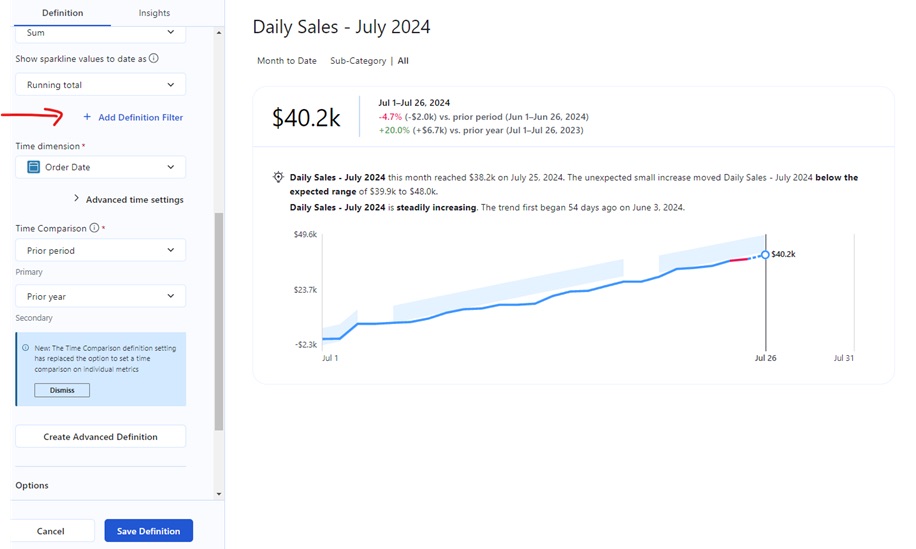
Easy! You just create a Definition filter, which is something similar to Tableau Extract, wherein you filter out data before you start conducting your analysis. When you add a definition filter, all of your results would be for the filtered data based on the condition provided. Any metric filters that you specify and use once the definition has been created would act on this filtered data, not the original dataset:
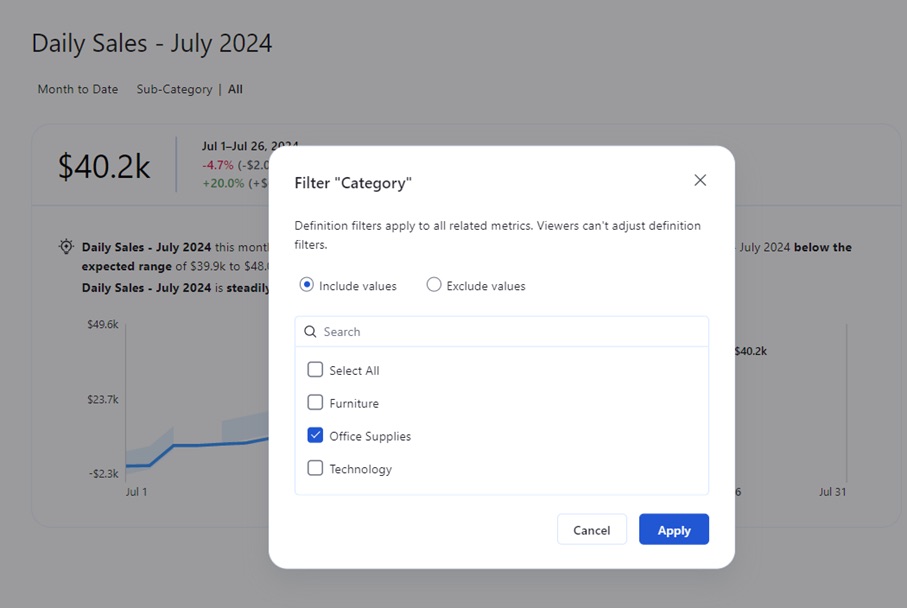
When I save my metric definition, my metric would now only show the breakdown for the different sub-categories in Office Supplies. The same goes for the Metric Insights, only trends for products under the Office Supplies Category will be available:
It is important to note that employees across the enterprise can be assigned different levels of access when it comes to these metric definitions. While Creators will have the permissions to build new definitions, Viewers will only be able to follow those metrics and interact with them, provided they have access to the published data source upon which the definition was originally built.
Great, I’ve Created My Definition and Followed the Metrics I Want To See. How Do I Ensure They’re Delivered to Me?
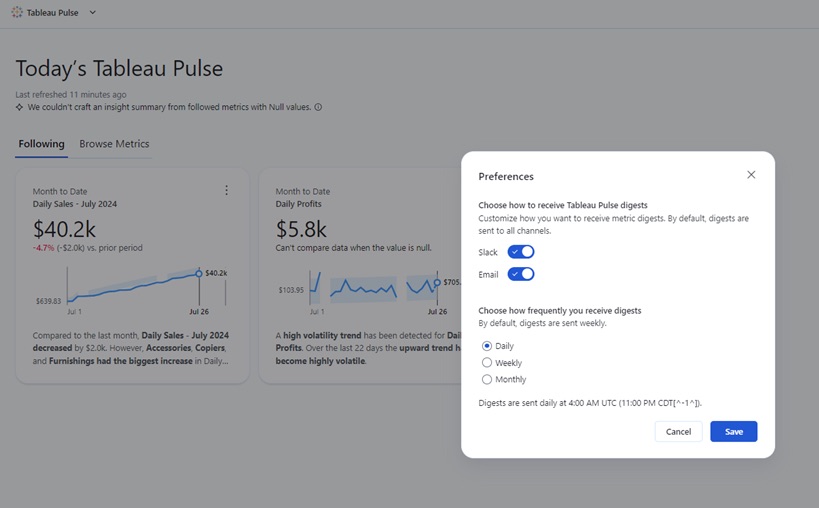
Tableau Pulse can currently deliver “digests” directly to your Email and Slack. The mode in which you receive your insights depends on what has been configured by your Site Administrator.
In case your organization doesn’t use Slack, you can always choose to have your metrics delivered to your inbox.
In Tableau Pulse, when you edit your Preferences (top right corner), you have the option to select the frequency at which you want your metrics to be delivered, and where you wish to receive them:
As of April 2024, Tableau has announced its partnership with Microsoft and has mentioned that Tableau Pulse will be available for integration with Microsoft Teams soon.
This Looks Cool, but Our Organization Is Not on Tableau Cloud/We Have Tableau Cloud but Still Haven’t Started Using Tableau Pulse
Not on Tableau Cloud yet?
InterWorks to the rescue! If you’re considering migrating to Tableau Cloud, let’s do a Migration Assessment to fully inform your decision.
On Tableau Cloud, but unsure where to start with Tableau Pulse?
InterWorks can assist you with a personalized AI Readiness Assessment, in which we’ll help you identify top use cases for Tableau Pulse within your organization and advise on how to get more “Pulse ready.”
Contact us here to kick-start either of these efforts.