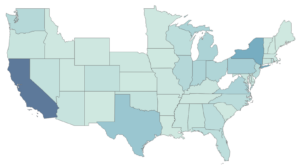
Customer Question: “When I’m using filters on my map visualization, if the filter returns null values for any state, that state disappears from the map. How can I make a map that will show state outlines even when there’s no data?”

There are, as with many things in Tableau, several ways to solve this problem, depending on your data’s setup and several other factors. For this particular client issue, we took a bit of a simpler approach as all of their filters needed to apply to a single map layer.
First, we created a simple Excel sheet that contained all the United States states that should be pictured in the map. To remove extraneous map elements like Canada and Mexico for this view, we set the background map to wash out completely.
Then, we added that data source as a second (not connected) data source into Tableau Desktop. Then, add the State field from your scaffold as a new Marks layer to the visualization:
Our last check was to move the static map behind the map layer that was to be filtered and try it out:
If you’re curious about other use cases for using unconnected data sources in a single map, you can check out a blog post from fellow InterWorker Rowan Brandum here.

