
As I started brainstorming new content, I wanted to do something a little less edgy and a little more fun. Thus, I had this fantastically random idea of capturing some of the greatest words in the English language and maybe help you learn how a few could even apply to data analytics. The list I came up with is ranked and in ascending order, so that means I saved the best for last.
Counting Down the Top 16
16. Vivacious
By definition, this word refers to “lively, exciting and attractive qualities.” In my line of work as an Enablement Consultant, I have the wonderful privilege of teaching technical things. When I walk into a classroom with a group of eager participants, I can oftentimes see just how excited and motivated they are to learn something new. The participants’ vivaciousness gives me extra incentive to do a great job.
15. Felicity
We all love being happy. Felicity is “elevated happiness.” When finishing a client project or completing a workshop — and everything went just like I was hoping it would — I’m overcome with felicity. I feel best when others succeed, so that’s the quickest path to heightened happiness for me. What about you? Find that out for yourself and use it as a driving force in both your professional and personal life.
14. Blob
Honestly, it’s just fun to say, “Blob.” In REST API language, we use blob operations to store text and binary data as objects in the cloud. In short, these objects help optimize data for processing. As far as actual definitions go, it’s a drop of a thick liquid or viscous substance. It’s used brilliantly for the naming of the most unique creature on the planet: the Blob fish. Also, the movie “The Blob” from 1958 is an all-time Sci-Fi classic. Watch it, if you dare!
13. Strike
This word has over 200 definitions. I’m sure by volume alone, it has to be relevant to data analytics somehow. Of all the definitions, my favorite is, “a sudden attack.” It’s also used commonly in sports. I love hearing baseball umpires call, with their trademark gusto, “Strike!” Some umps do it better than others (watch Dutch Rennert from the 1989 World Series on YouTube). It’s vocal gold. Also, congrats to the Texas Rangers, your 2023 World Series Champions!

12. Oxymoron
You could say that something is “awfully good” or “stupidly clever.” Those are oxymorons. We all use these in speech and written language as literary devices for impact. Other common ones are, “clearly misunderstood,” “alone together,” and “busy doing nothing.” It’s also interesting how some applications promote “self-help” tools. You can see the humor in that right?
Completely unrelated: we have our own self-help tool for our customers — InterWorks Assist. It’s round-the-clock access to data experts, so you can get past the snags holding up your progress, resolve challenges that surface in your work and receive strategic support anytime it’s needed. Find out more here.
11. Phenomenal
This one means “remarkable” or “extraordinary.” This is exactly how I would describe the interns at InterWorks. I could name them individually from this past summer, but you’ve likely already seen their names on our blog. They are absolutely representative of the best talent in the world. If you want to understand day trading, Typeform, Snowflake or baseball stats, they pretty much do it all.
10. Cryptic
One of my favorite shows growing up was “Tales from the Crypt” produced by HBO. It was an ongoing TV series anthology of random horror stories. “Cryptic” means “mysterious” or “obscure.” It’s also a part of the word encryption, which is how passwords are stored in databases. Passwords can be stored using single-encryption methods, but most companies use double-encryption to protect against cyberattacks. The more obscure, layered and difficult the encryption is, the better. Just ask our experts!
9. Triptych
You know how some art pieces are continuous and span across three individual panels? That’s basically what a triptych is (pronounced trip + tick). For example: When I put together a dashboard in Tableau, I could have my three primary KPIs on a single sheet, or I could create a separate sheet for each of those values and put them side-by-side-by-side on a dashboard for added flexibility in formatting and filtering.
8. Whammy
This is a gem of a word. It can mean a “blow” or an “unlucky influence.” Or, you might recall a shortened version of the word via the British band called Wham! who sang “Wake Me Up Before You Go-Go.” How does this word relate to data? Well, who doesn’t like to listen to good music while working with data? Also, lead singer George Michael was a favorite of mine growing up. You also heard the term “whammy” on the “Press Your Luck” TV show and from an “Anchorman 2” character, the very inappropriate Champ Kind, who coined the term in his broadcast and even opened up a restaurant bearing the same name.
7. Swig
In the list of words that rhyme with pig, this is my favorite. A swig is drinking a beverage using large gulps. I don’t know any other way to drink, so I just keep swigging along in life. I also stumbled across an interesting acronym, SWIG, relating to Single World Intervention Graphs. This is a rigorous mathematical approach to unifying counterfactual analysis and graphical outcomes in order to study things like human survival rates (by Thomas Richardson from the University of Washington, if you’re interested).
6. Essential
What an awesome definition. It means, “absolutely necessary” or “critically important.” When trying to find an adverb to start a sentence, it’s a perfect transition word. In data analytics, all of the InterWorks trainings that are 1-hour workshops are labeled as “Essentials.” We have Tableau Essentials I, II and III. We have ThoughtSpot Essentials I, II and III. There are Visual Analytics Essentials, Dashboarding Essentials and so many more. Take a look at our offerings and let us know if one of them sounds appealing to you. Then, just get in touch and we’ll get something scheduled.
5. Plethora
First, let me just say — the scene in “Three Amigos” where this word is appropriately used, is one of my favorite movie quotes of all time: “Would you say I have a plethora of piñatas?” When you have a plethora of data, oftentimes that represents an overwhelming amount of data. In tools like Tableau Desktop and Power BI Desktop, you can do some quick cleaning and shaping, to make the data structured and easier to represent visually in each of those respective tools.
4. Concatenate
When first learning how to use Excel and building more complex sheets using Visual Basic for Applications (VBA), I quickly learned that being able to concatenate, or combine, data from multiple sheets would help me be more efficient and accurate than trying to manually bring data strings together on my own. All the best Business Intelligence tools let you do the same. In the form of string functions, you can concatenate in Looker, Power BI, ThoughtSpot and Tableau.

3. Dynamic
This word derives from Greek origins, dunamis, meaning “power.” When developing views, sheets, reports, dashboards or liveboards, you’ll typically start with an overview or summary of the data. From there, you’ll give consumers dynamic ways to drill-down, filter or choose more meaningful components based on their individual role or responsibilities. Giving end-users the power to find the insights and answers they need most from the data is a recipe for visual analytics success.
2. Flawless
For most of the visualizations I build, I want them to look clean and be of the highest quality. You could say my goal is a flawless view of the data that is easy to interpret, is aesthetically pleasing and flows in such a way that draws users in. The last thing you want is to create something that is so complex to discern or difficult to use that people leave and go somewhere else to find answers.
1. Petrichor
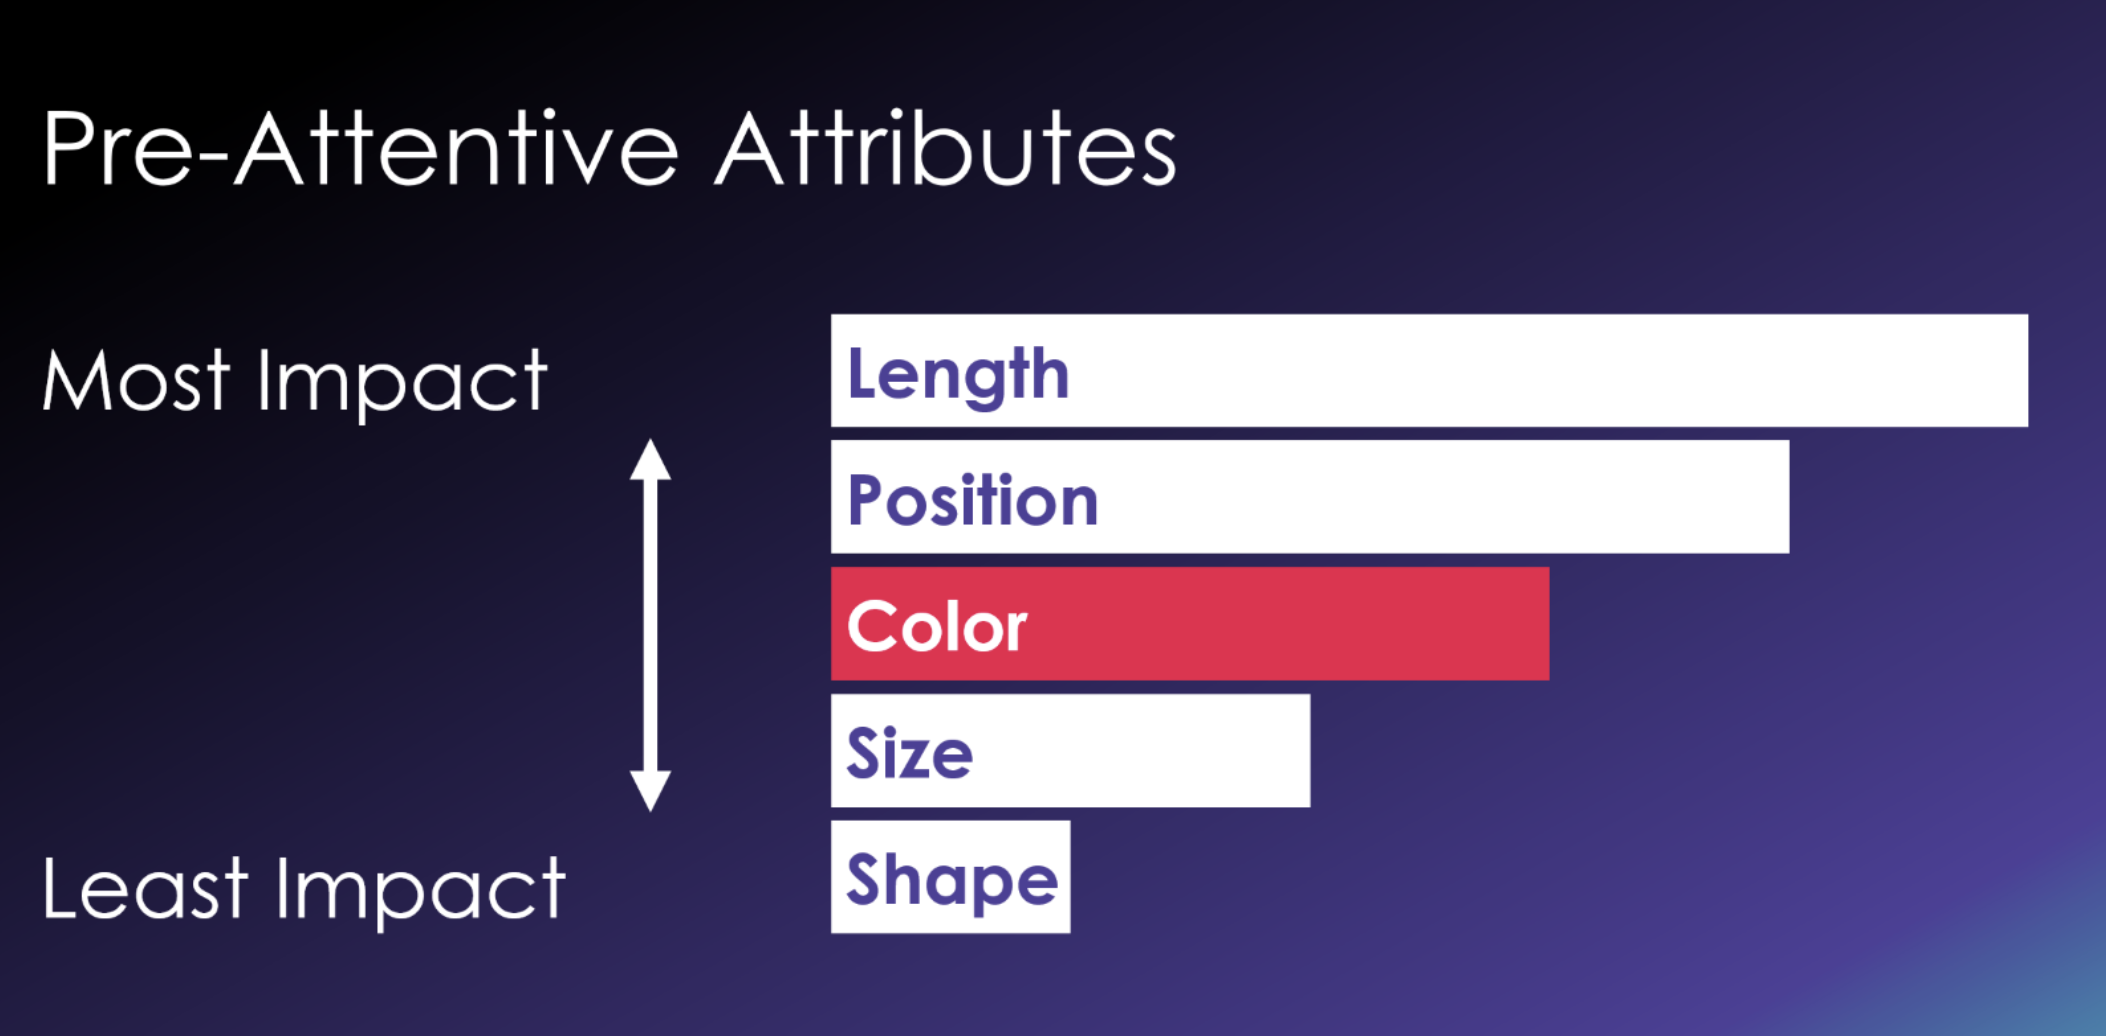
You know the smell of rain? This is the word for that. Humans can pick up the storm’s petrichor, or collective scent of water, oil and bacteria, from miles away. In fact, humans can detect this odor of rain when falling onto dry ground in concentrations of 0.4 parts per billion, which puts us into rare territory with dogs. Humans are programmed with this sense, because the oldest ones on our planet likely relied on it for survival. Our brains are also great at processing pre-attentive attributes, which are visual patterns people don’t have to think about to understand. In visual analytics, speed to insights is critical because that leads to speed to something actionable!
Here are the most meaningful pre-attentive attributes you want to exploit when building views of your data regardless of the BI tool you’re working in:
Join me next time when I talk about the hardest words to spell in the English language. Who knows, I might even talk about a few more things that could help you with your work, too. Until then, have a great 2023 holiday season!