
For those who live by the Benjamin Franklin-inspired mantra “every second saved is a second earned” (or maybe that was actually about pennies?), this Tableau time saver post is for you.
It’s incredibly refreshing to know that regardless of whether you have been using Tableau Desktop for seven years or seven months, you can always rest assured that you can learn something new.
My goal is to simply help you uncover a few ways to steal back some time from your working day, as time is one of the few things that we haven’t quite figured out how to roll back.
Ctrl + M
There are plenty of keyboard shortcuts that are helpful. Above is one of my favorites for Tableau Desktop on Windows. This is basically a shortcut for creating a new worksheet for your Tableau Desktop workbook (not to be confused with the shortcut for creating a new workbook itself which is Ctrl + N). When I’m pressed for time to get my views built, I’ll use the Ctrl + M shortcut, so I don’t have to go to the top or bottom of my workbook in order to create my new sheet. For our fellow Mac users, this would be Command + T from your workbook.
Removing Grid Lines (Workbook-Wide Formatting)
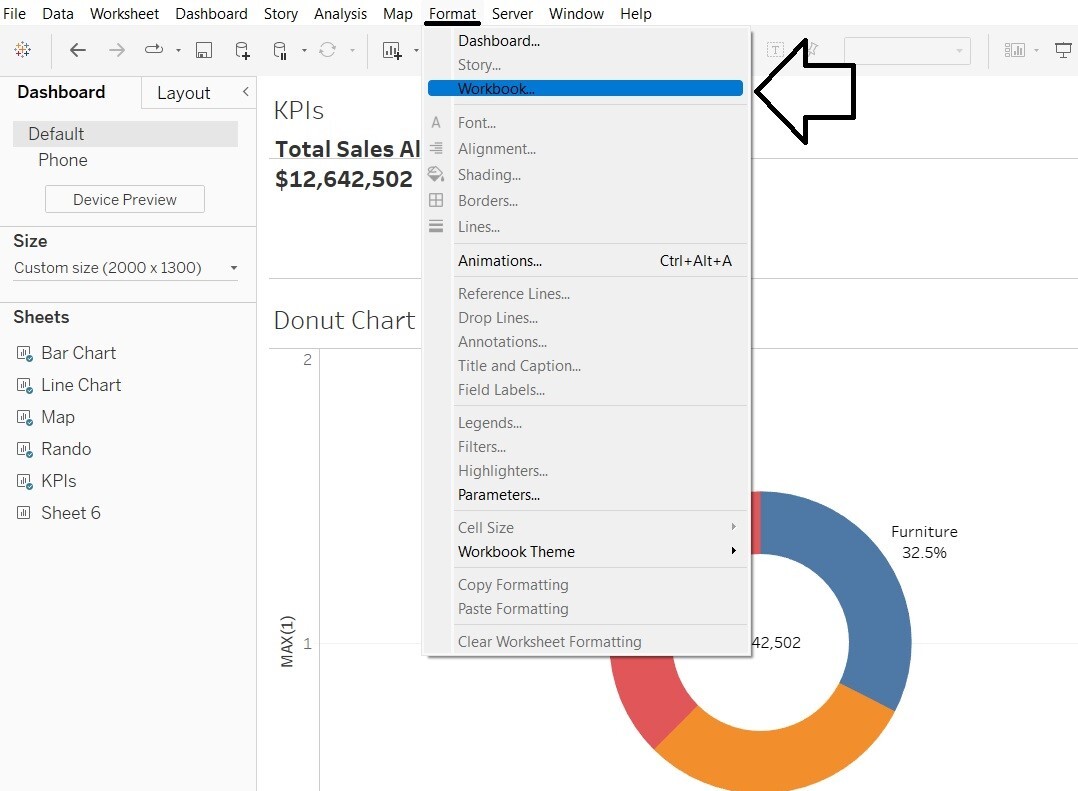
Oftentimes, an author or creator of a Viz will spend quite a bit of time formatting individual sheets. There is one format option in particular that I’ll always go edit once I’m ready to cleanup and share my work: removing all grid lines. I want my charts to look clean, so I remove grid lines nearly 100% of the time, especially for sheets I plan to put onto a dashboard. Well, rather than having to format each individual sheet to remove those grid lines, Tableau Desktop has a tool available from the Dashboard menu, under “Format,” that lets you remove grid lines for all sheets…across your entire workbook (yes, you heard that correctly). Create as many views as you want, and then remove grid lines for all of them at once from your dashboard menu. As you can see below, the Format Workbook option allows you to do font formatting workbook-wide as well.
From the dashboard window, first locate Format > Workbook:
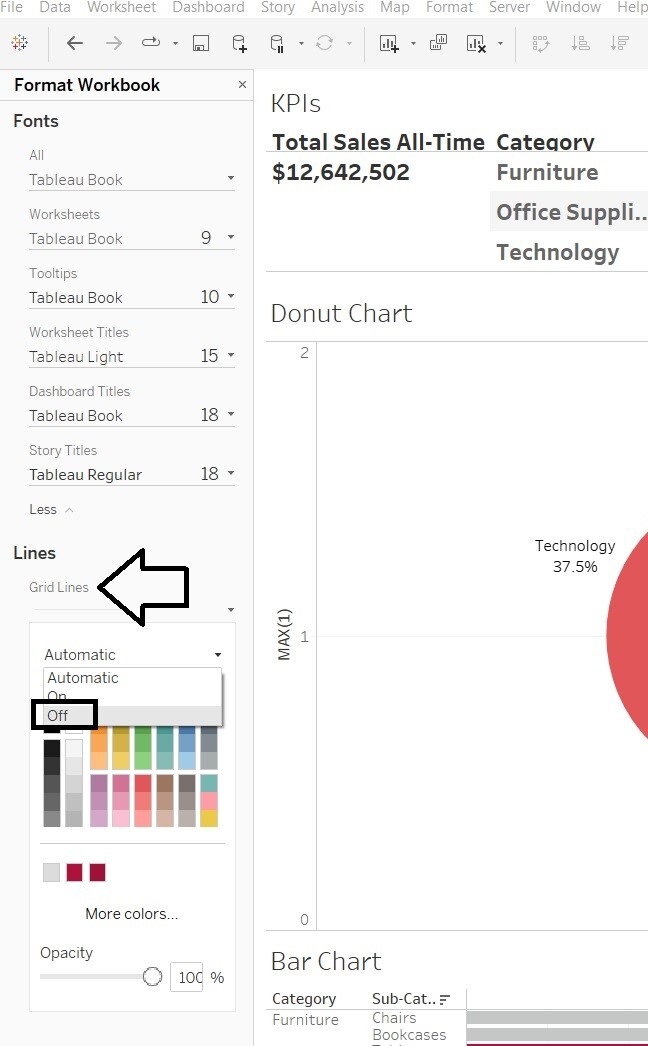
Then, from the Format pane, find Grid Lines > Turn Off:
Show as Filter
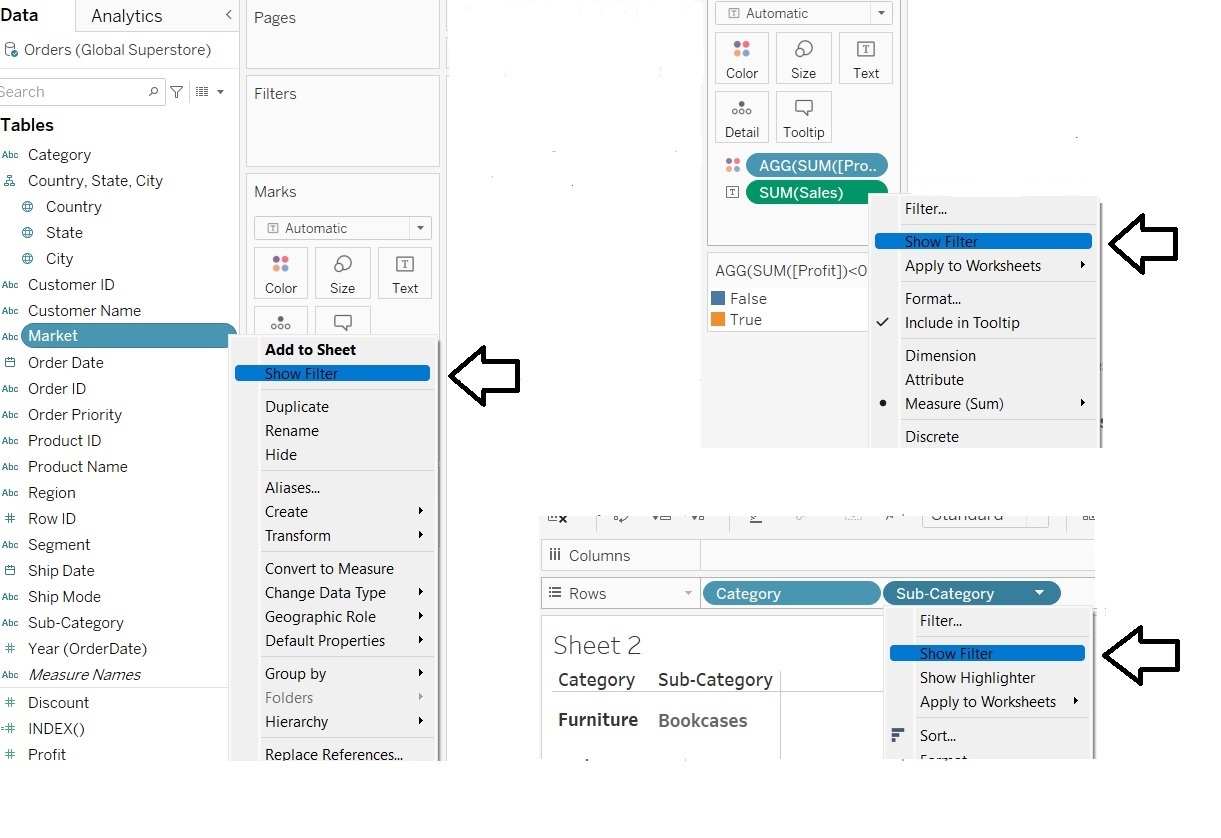
Did you know that you can simply right-click on a field from anywhere (from the Data pane, the Marks cards or the columns and rows shelves) and choose to “Show Filter” rather than having to go through the two-step process of dragging the field to the filter card and then choosing to show the filter once it’s there? Once I found that out, I would go ahead and by default choose the “show filter” menu option on my field name, so that the filter would be both created and shown at the same time. Then, I would go back to edit the filter as needed if I needed something other than the default filter behavior.
A collection of “show filter” examples from different areas of the view:
Ctrl +
This is the quickest tip, but maybe the most important if you are going to be creating a bunch of calculated fields. From the calculated field dialogue box, at least on my laptop screen, the font can be hard to read as I type my function out. If you simply press “Ctrl” and “+” a few times, you can make the font magnitudes bigger, so you can easily read the calculation as it is being typed (and you can use the shortcut at any time once the create calculated field window is open). This will help to minimize mistakes such as using the wrong function, field or even safe guarding your text strings to ensure correct spelling or capitalization.
Bonus: It is also worth pointing out that when creating a calculated field, it can be much easier to pull your fields in from your view to complete your calculation, which will absolutely help with saving time and being accurate. This is one of the only times you can drag a field into another location without replacing it.
Create a New Calculation from the Marks Card
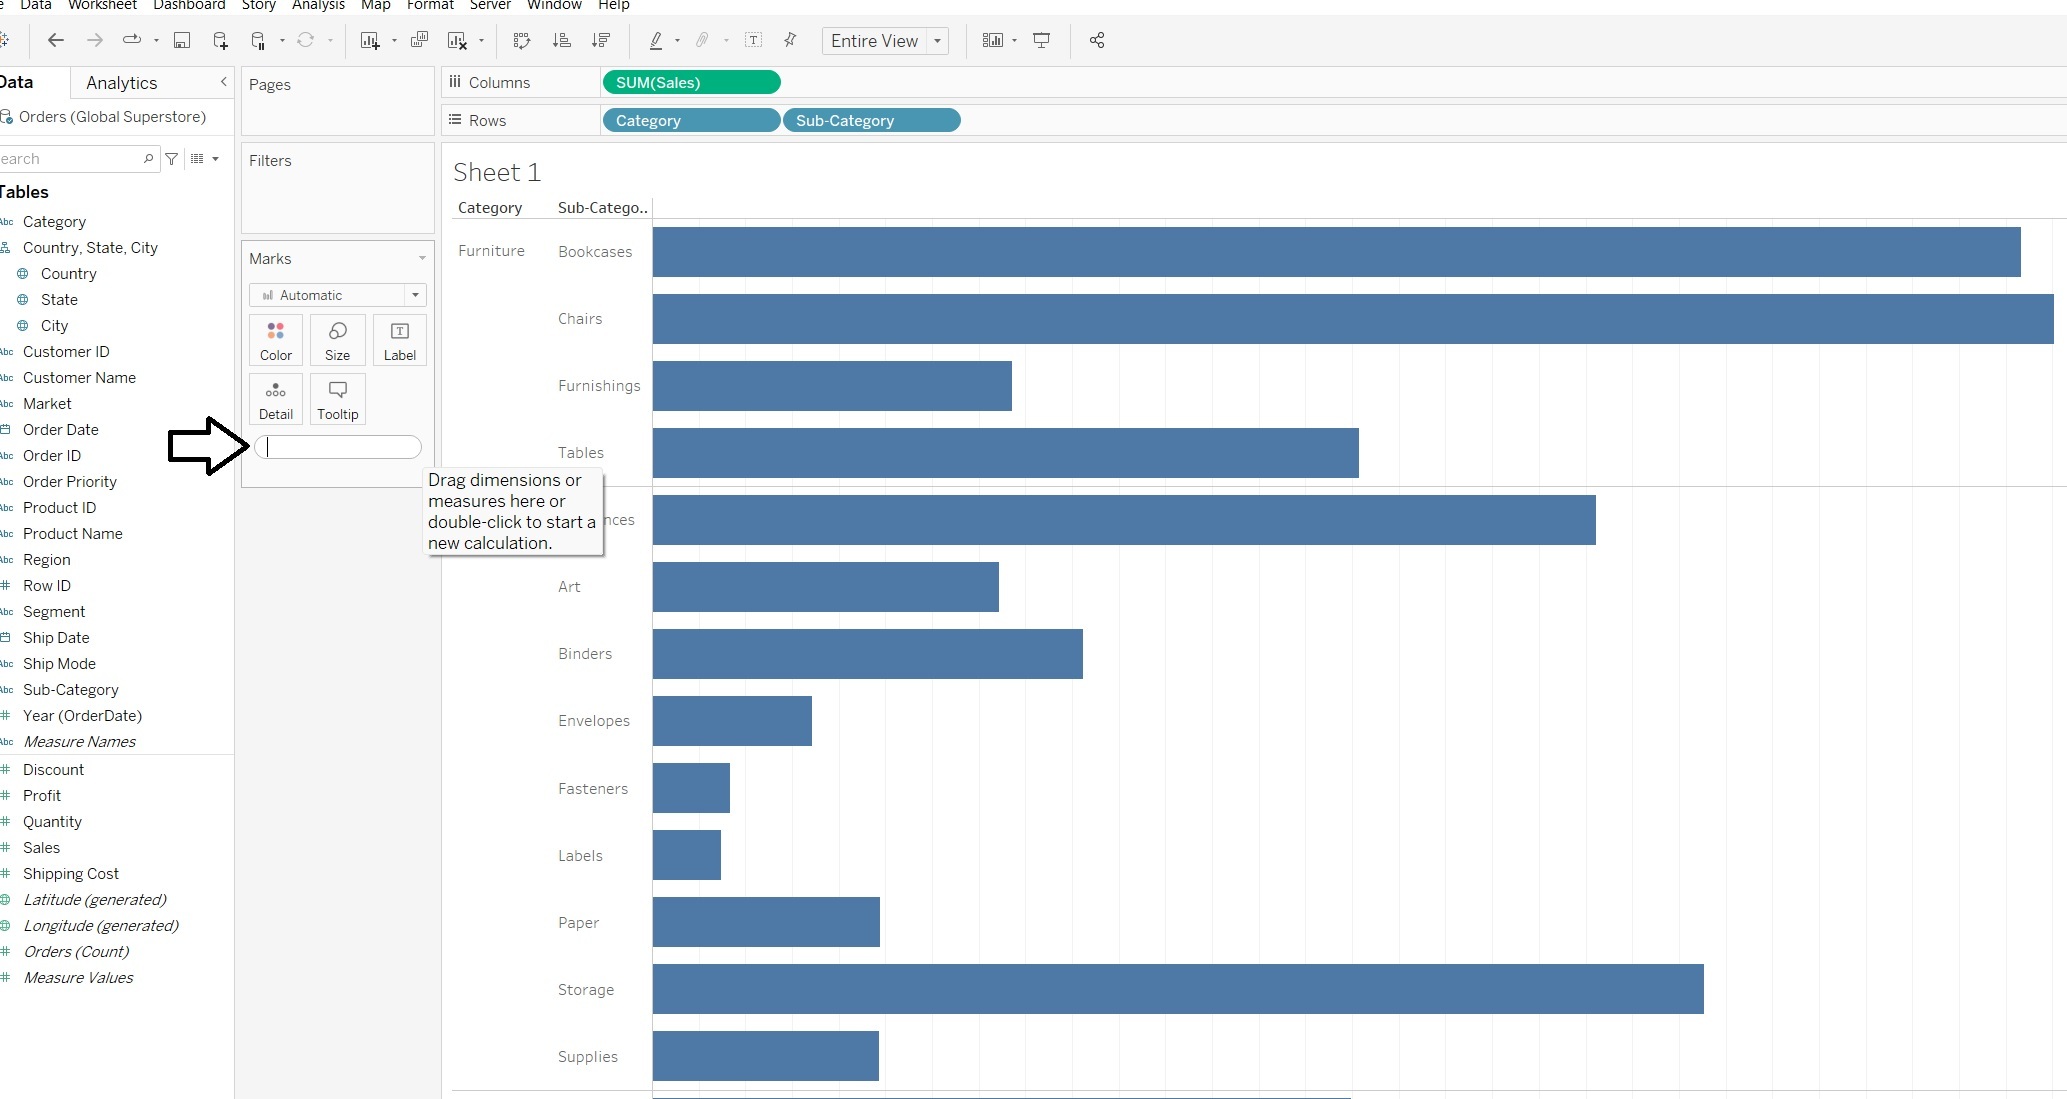
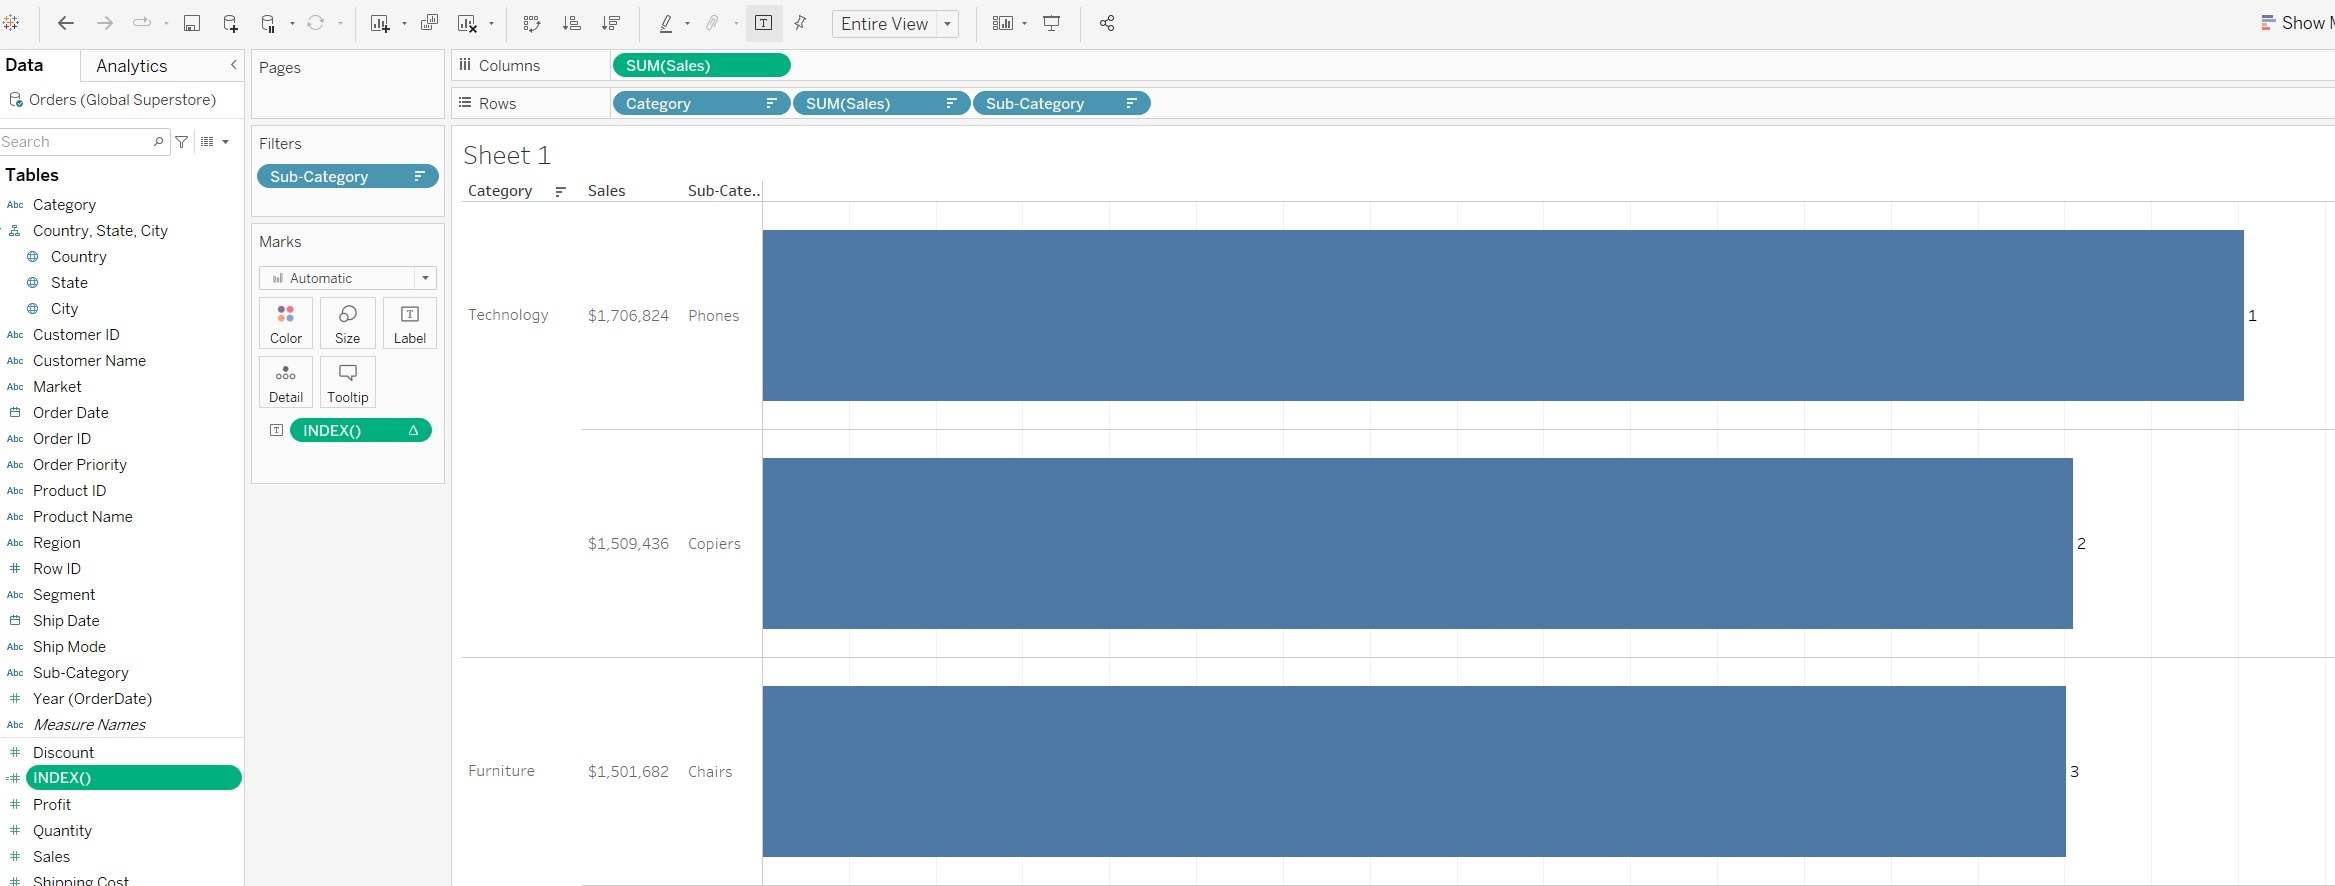
Calculations can be initiated directly from the Marks card or from the Columns and Rows shelves. I use this quite a bit for a quick Boolean statement such as “SUM([Profit])<0” or even using an Index function. By the way, the INDEX() might be my favorite table calculation due to its enormous flexibility. For example, if I want to label my top 3 selling Sub-Categories, I can double-click in the Marks card area, type my Index function and then add it as a label to show my rankings.
Bonus: I can then bring a copy of that function from the Marks card area (or Columns/Rows shelves) into my Data pane, so the function becomes re-usable across my workbook.
Here’s where to initiate a calculation in the Marks card area with a double-click:
For example, the index function applied, put onto Label and copied to the Data pane:
Ctrl + Click
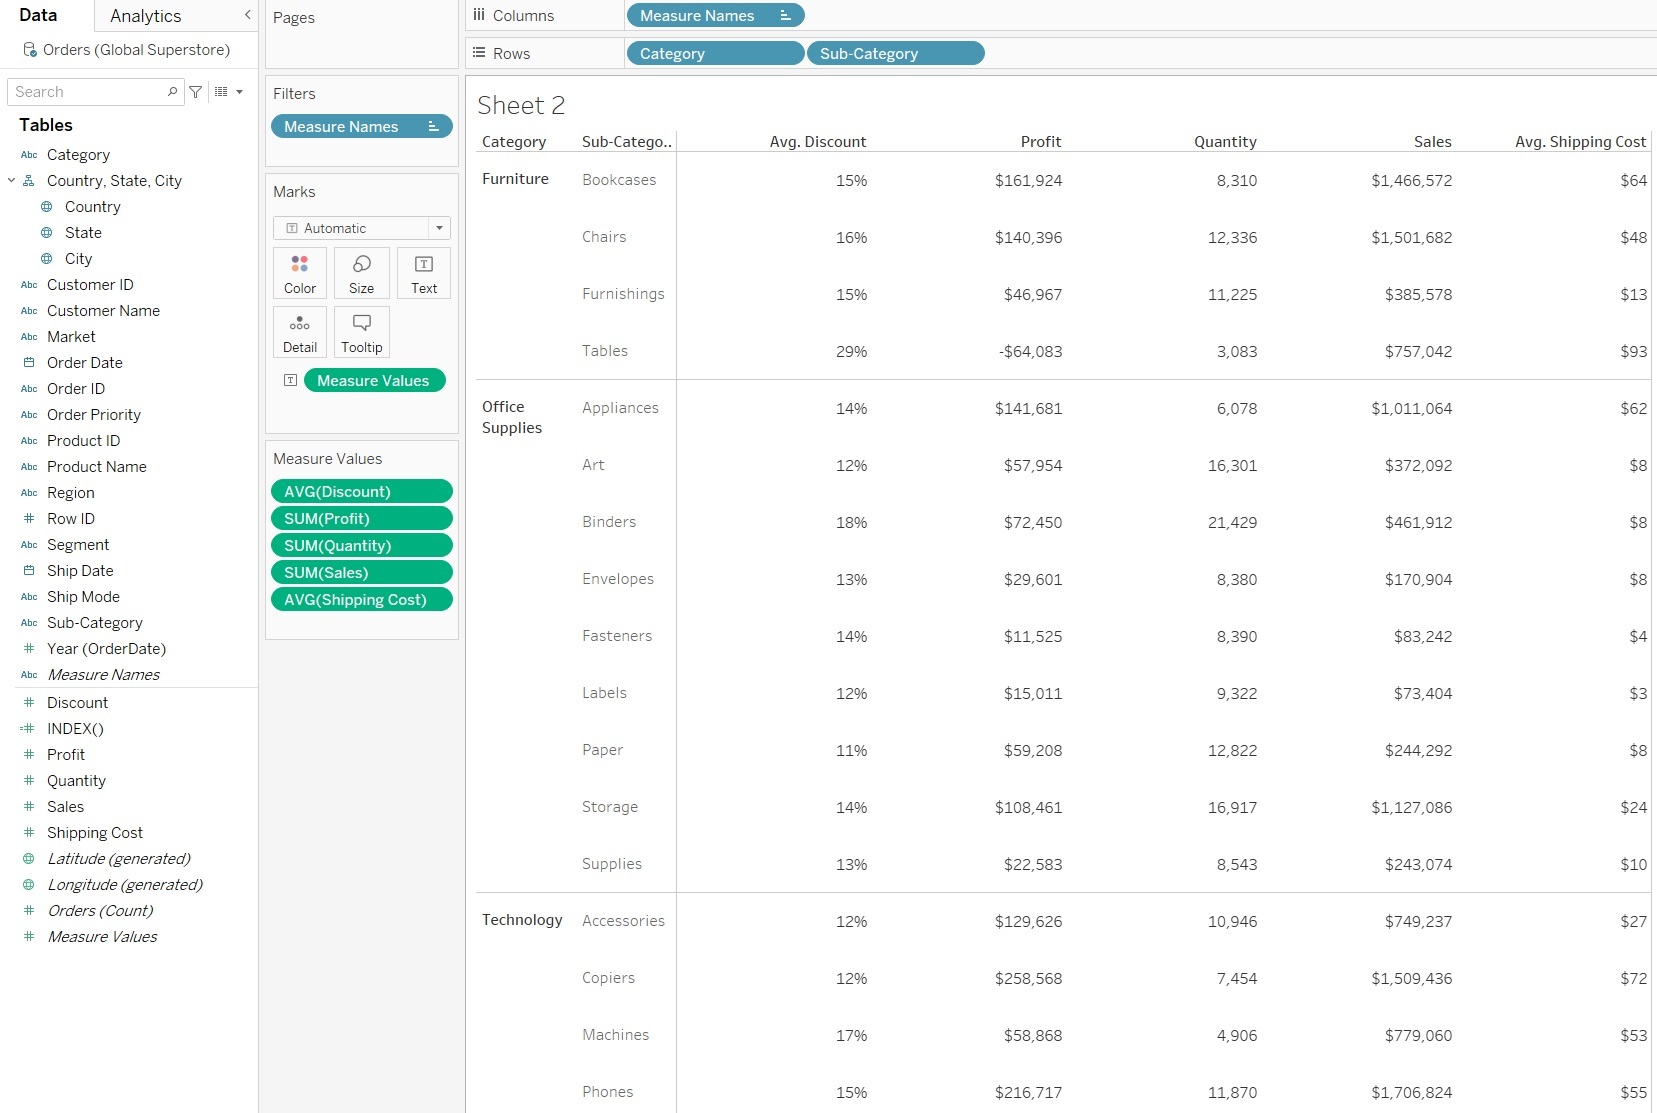
I use this keyboard and mouse shortcut all the time in Tableau Desktop. When I am creating a text table or crosstab, I’ll usually set up my headers and then bring all of my measures into the view at once. Using Ctrl + Click allows you plenty of other time saver opportunities across Tableau Desktop too. I promise, once you’ve got this mastery down, you can use it to save yourself dozens of extra clicks. For example, you can use the Ctrl + Click to format the default properties for all of your fields at once. In the case that multiple fields should be represented as a currency, you can Ctrl + Click your fields, then select the menu for any of the highlighted fields and go into “Default Properties” to adjust the number format for all of them at once. For Mac users, this would be Command + Click. Honestly, the default property adjustment to your fields in your data pane can be very useful not just with numbers, but with other default properties such as aggregation and colors too.
You can Ctrl + Click on multiple measures at once:
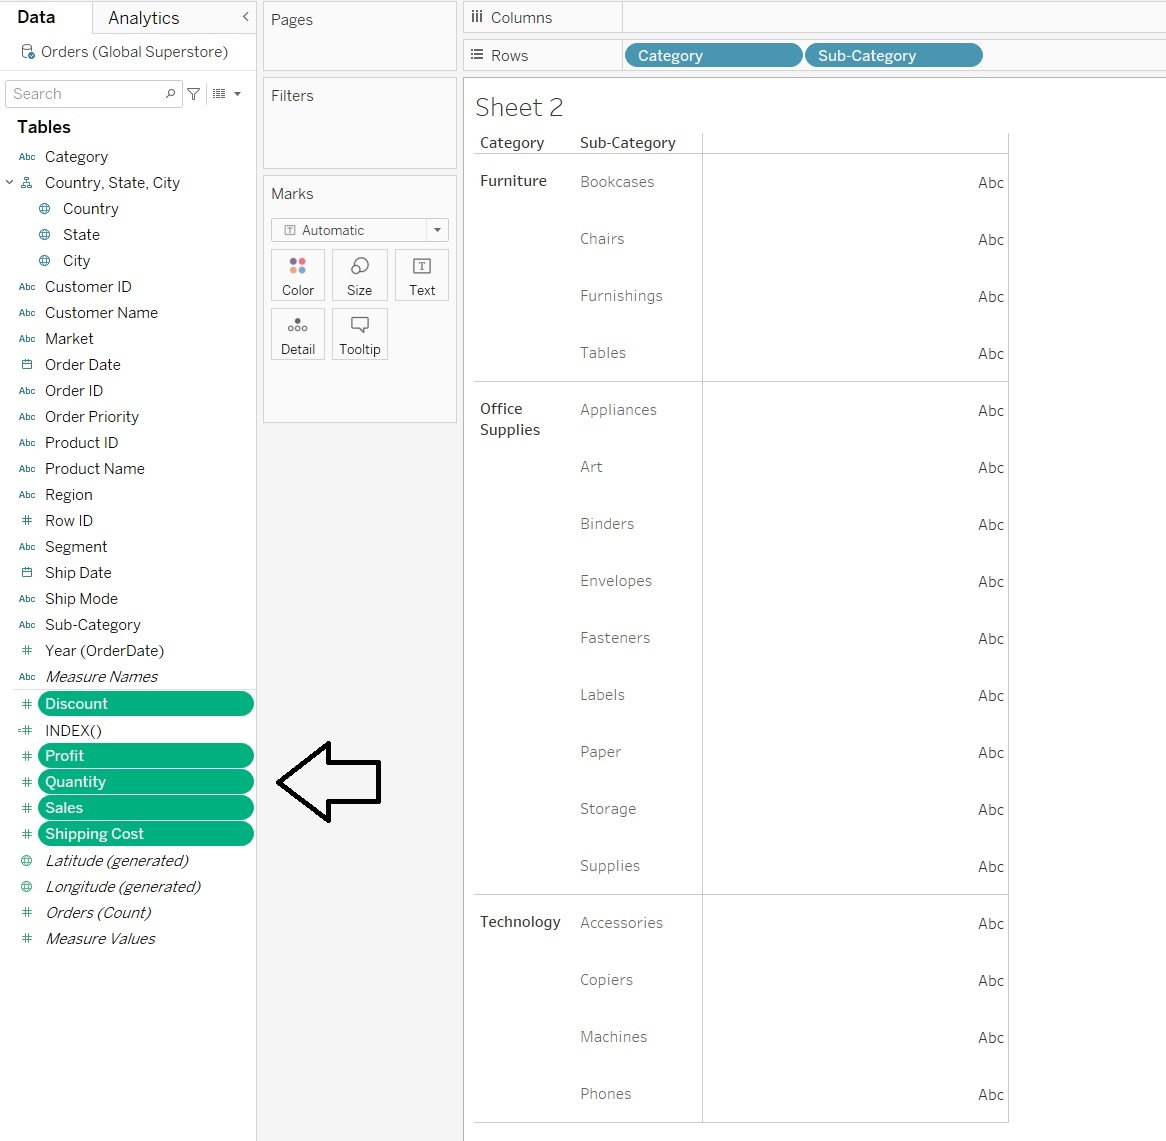
Then click and drag the multiple-selected fields at once into the view:
Resize Cells in a Crosstab
Before jumping into the toolbar to do a fit width/height or entire view, you can use the Ctrl + Left arrow or Ctrl + Right arrow to adjust your row widths, making them narrower or wider. You can also use Ctrl + Up and Ctrl + Down arrows as shortcuts to adjust the cell height, making the columns taller or shorter. Once you’ve locked in a Fit, such as Entire View, that overrides your ability to use the quick short-cuts noted here, so play around with the Standard fit and see if there’s one of those shortcuts that you might find useful for these quick crosstab adjustments.
Ctrl + A
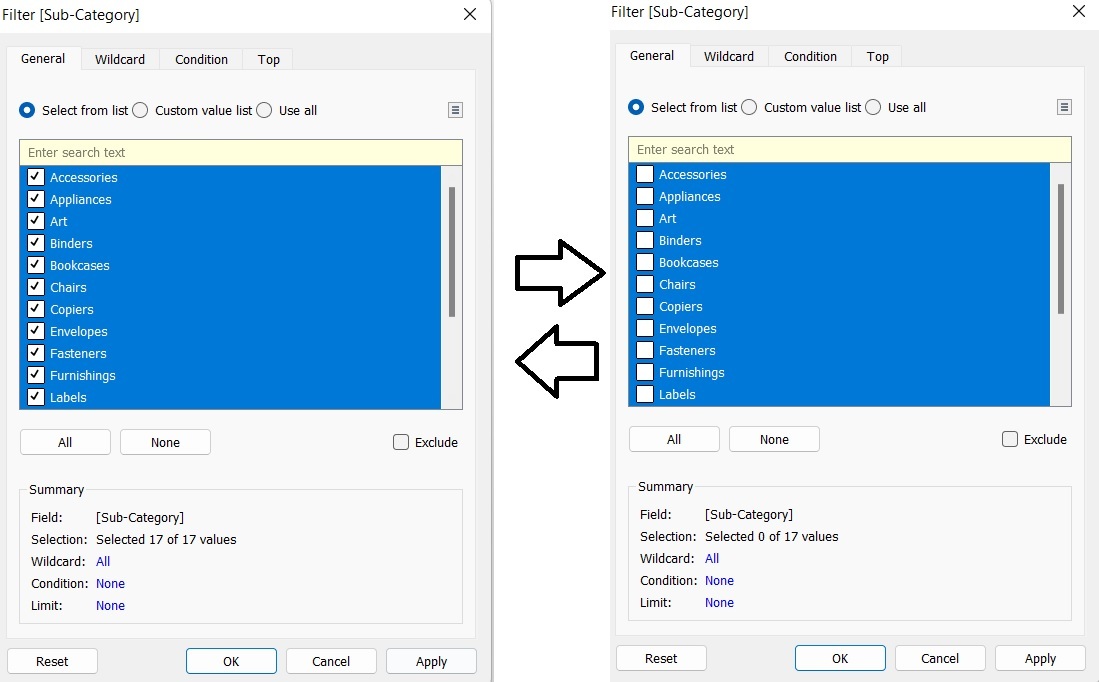
When needing to deselect or select all items from a list in a dialogue box, you can use Ctrl + A. Left click to choose or highlight one of the items in your list, then use Ctrl + A to do a ‘select all’ or ‘deselect all’ very quickly.
Then, you can check-mark an item to have that apply to all items or to none. Select an individual item in the list once finished to reset:
Workbook Organization
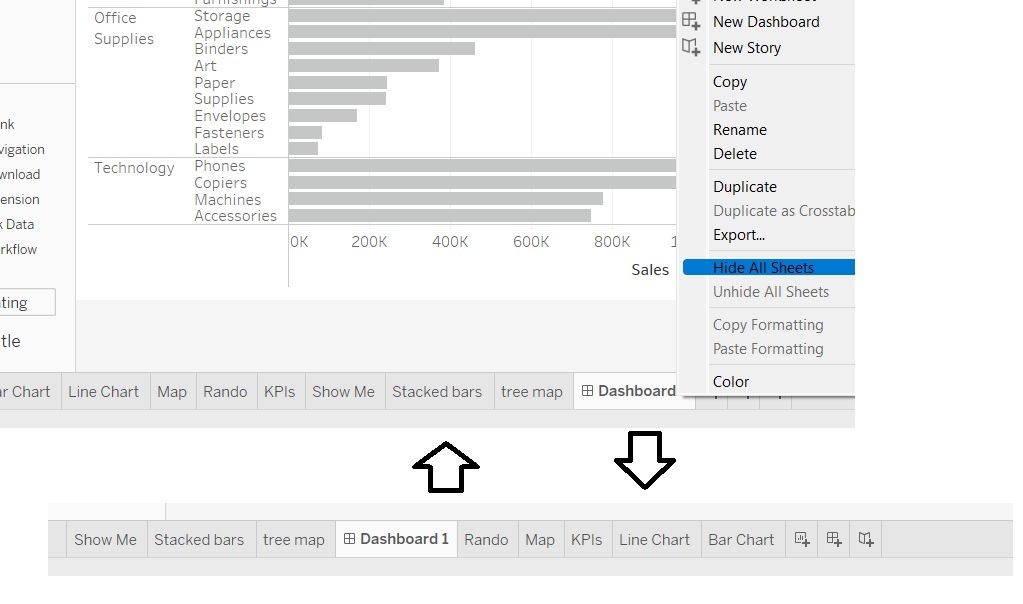
The last time saver applies to the organization of your workbook sheets. Let’s imagine you’ve done lots of productive, iterative work for the week. You may have 15 or 20 different individual sheets created. Through best practices, we know 20 sheets on a dashboard will probably do more harm than good, so we trim the dashboard down to just the most meaningful insights that we’ll want to share with our end user. After building your dashboard, you can right-click the dashboard title from the tab menu and click to “Hide All Sheets” for the given dashboard (this will hide only those sheets used on that dashboard). Then, when you are ready to bring those hidden tabs back, you can right-click the dashboard tab again to “Unhide Sheets.” Conveniently enough, all of the associated sheets will be shown immediately following the dashboard tab when reshown. Rather than having to drag workbook tabs around, or dragging sheet icons from the grid-view to bring sheets closer to their related dashboard, you can use this 2-click trick to accomplish the same result.
A before and after image of the tabs after hiding and un-hiding its associated sheets:
Have some tips you think are useful too? Feel free to share with us on Twitter or LinkedIn.