
I recently read this great post by Sarah Battersby about using QGIS to isolate a specific geography on a map in Tableau. Isolating geography is a great way to draw your user’s attention to the focus area, reduce dashboard clutter and give your map a nice, clean feel. For example, if you were building a dashboard that featured locations within the state of Oklahoma, which of the maps below would you choose:
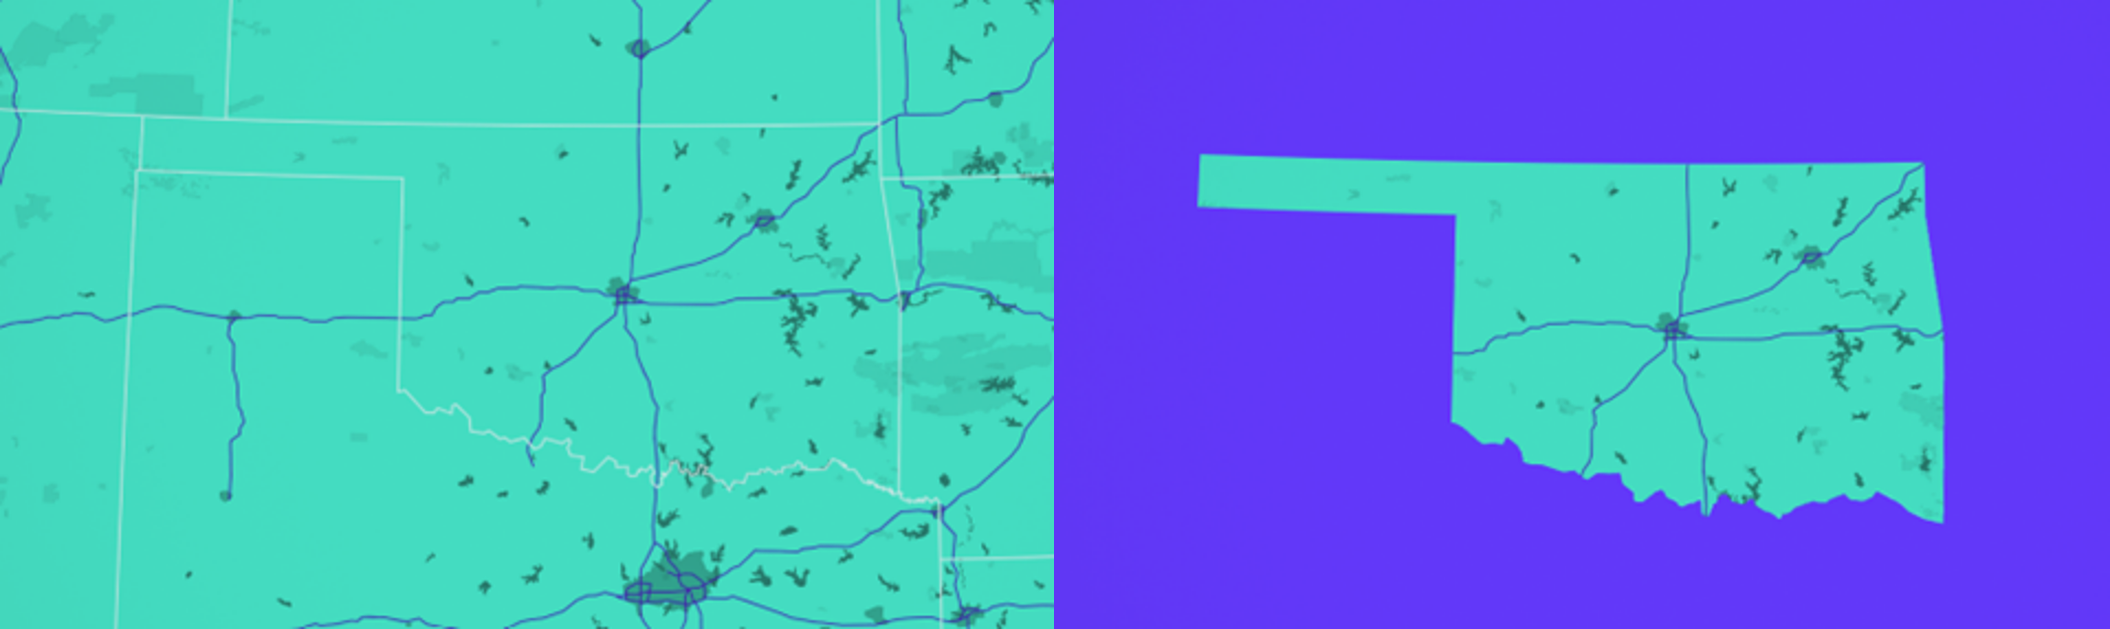
Exactly.
Anyway, Sarah’s post gave me the idea to write about another way to do this. Instead of using QGIS, this approach leverages Mapbox and its super simple integration with Tableau. I’ll use the map above as an example and run through how to make a “mask” in Mapbox, and then bring that map into your Tableau dashboard.
Step 1: Download the Spatial Data
The key to making a geographic mask is having spatial data that encompasses your area of focus as a feature of a wider layer. The example above isolates Oklahoma, so a layer of the United States with each state as a feature will do in this scenario. I used Natural Earth Data’s 1:50m Cultural Vectors, Admin 1 – States, Provinces layer, which you can download as a shapefile from the Natural Earth Data site:
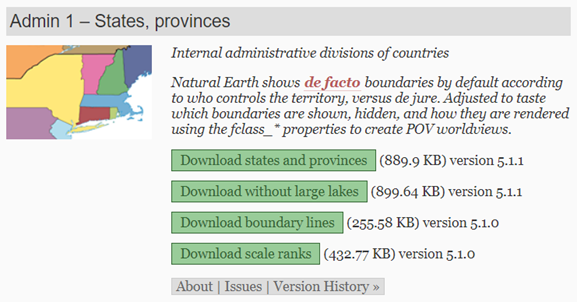
If you aren’t familiar with Natural Earth Data, it’s a great free resource for high quality vector and raster layers.
Step 2: Upload the Spatial Data to Mapbox
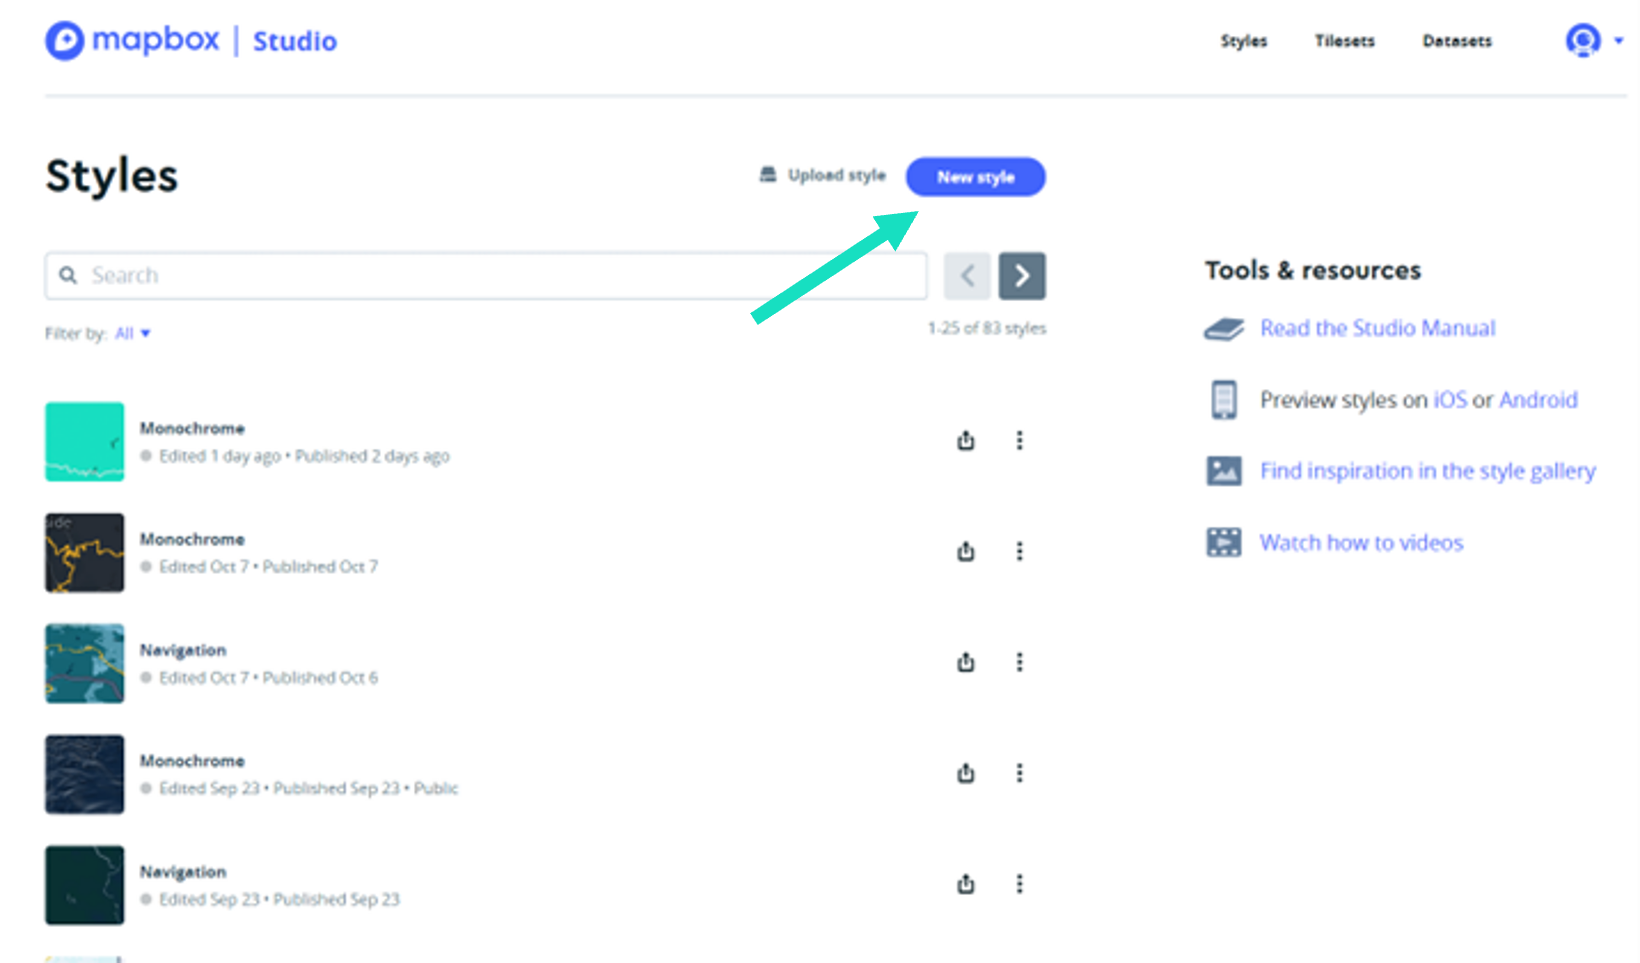
Now that you’ve downloaded your data, you can navigate to Mapbox, specifically Mapbox Studio. If you don’t already use Mapbox, it’s easy to set up a free account. Inside Mapbox Studio, you’ll want to create a new style and choose a template:
You can choose whichever template fits best with the map you’re making. Once opened, click “Layers,” then the “add new layer” icon, then “upload data” like so:
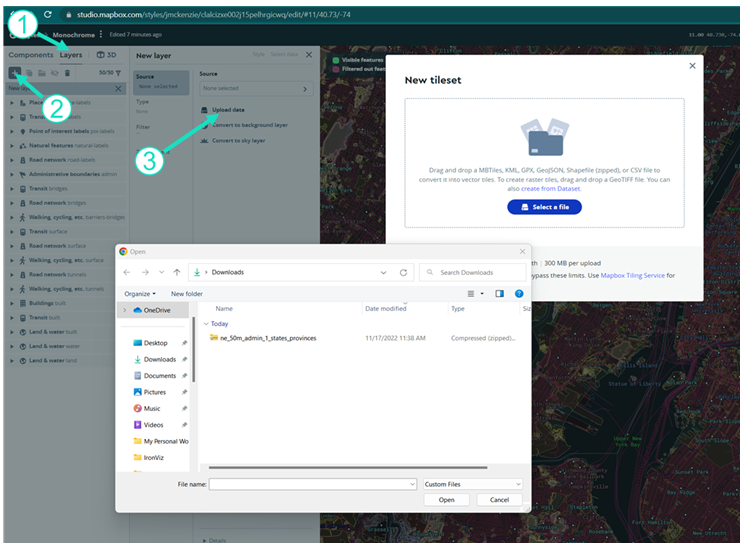
Now, you can select the zipped shapefile that you just downloaded. Note that you can load other file types into Mapbox including MBTiles, KML, Geojson and more.
Step 3: Add the New Layer to Your Map
Once loaded, you need to add the new layer to your map by navigating to the “Source” window and selecting it from the list of unused sources. Once added, you have the option to filter the data, set its visibility based on the map’s zoom extent and select the data type (fill, line, circle, etc…). To make a geographic mask, you’re going to choose “fill.” You should see now see your layer in the map. Note that the bright green appearance will automatically change to black when you close out of the add data menu.
Step 4: Create the Mask
Click the newly added layer in the left-hand panel to close the “add data” menu and click on the “style with data conditions” option. Now choose a field with identifying information for the area you want your map to feature and search for or select the area from the list of values that appears. In this example, I use the “gn_name” field and select “Oklahoma.”
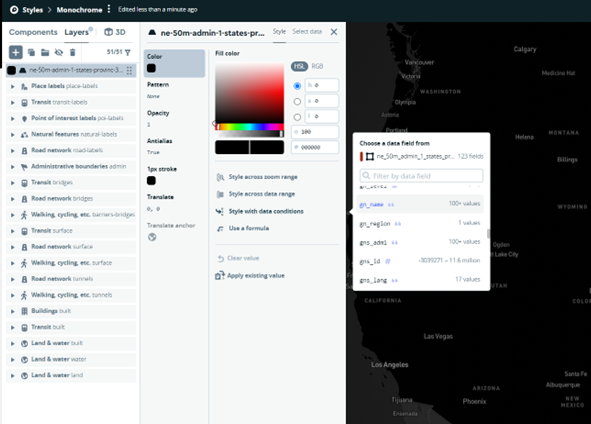
The value you selected will appear in the Data Conditions window. In my case it says Data field – gn_name is Oklahoma. You can now adjust the layer’s fill settings according to data conditions that you set. In the example above, I’ve set conditions that tell Mapbox to make the map transparent where the layer’s attribute value (gn_name) is Oklahoma and to make it black and opaque (the fallback value) everywhere else. Note that you can stylize the fallback value any way you choose, and you can add as many data conditions as you like.
Step 5: Bring the Map into Tableau
At this point you have an opaque black layer covering the United States (or whatever area you’re working with), with a hole punched out over Oklahoma, revealing the base map. The next step is to bring it into Tableau. Good news, it is extremely easy to incorporate basemaps you make in Mapbox with Tableau. If you don’t already know how to do it, here’s a helpful post.
Step 6: Remove Any Unwanted Layers
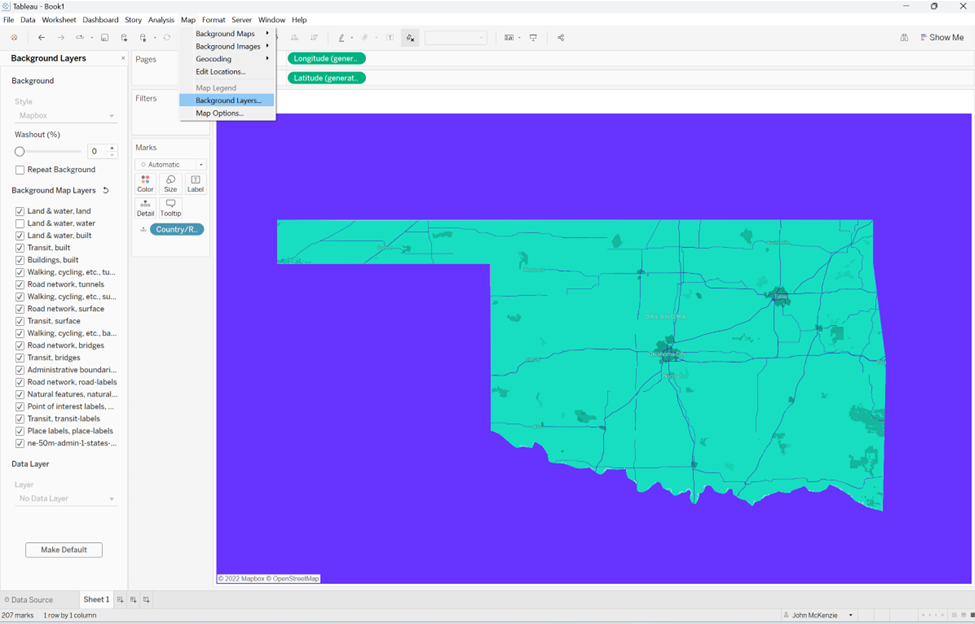
With your newly masked basemap in Tableau you’re almost ready to go. When you bring in your basemap, you might notice that it has unexpectedly brought in some unwanted place labels or roadways. These layers may have been hidden at the zoom level of the map while you were viewing it in Mapbox but now that they’re in Tableau, you can see them. Fortunately, there’s an easy fix. Navigate to the “Map” tab and click “Background Layers.” This will bring up a checklist of all the layers in your Mapbox basemap. Simply turn off the unwanted layers and you’re good to go:
Thanks so much for reading! This is just one of many ways you can use Mapbox to level up your Tableau mapping. Be sure to check out our other great Mapbox/Tableau blog posts, like this one on easy Mapbox integrations with Tableau, or another on geocoding in Tableau prep.