Pivoting without pivoting … it’s not a trap or a trick. This blog will take a look at how to use Tableau’s relational data model to pivot data without duplicating records.
When would you need this?
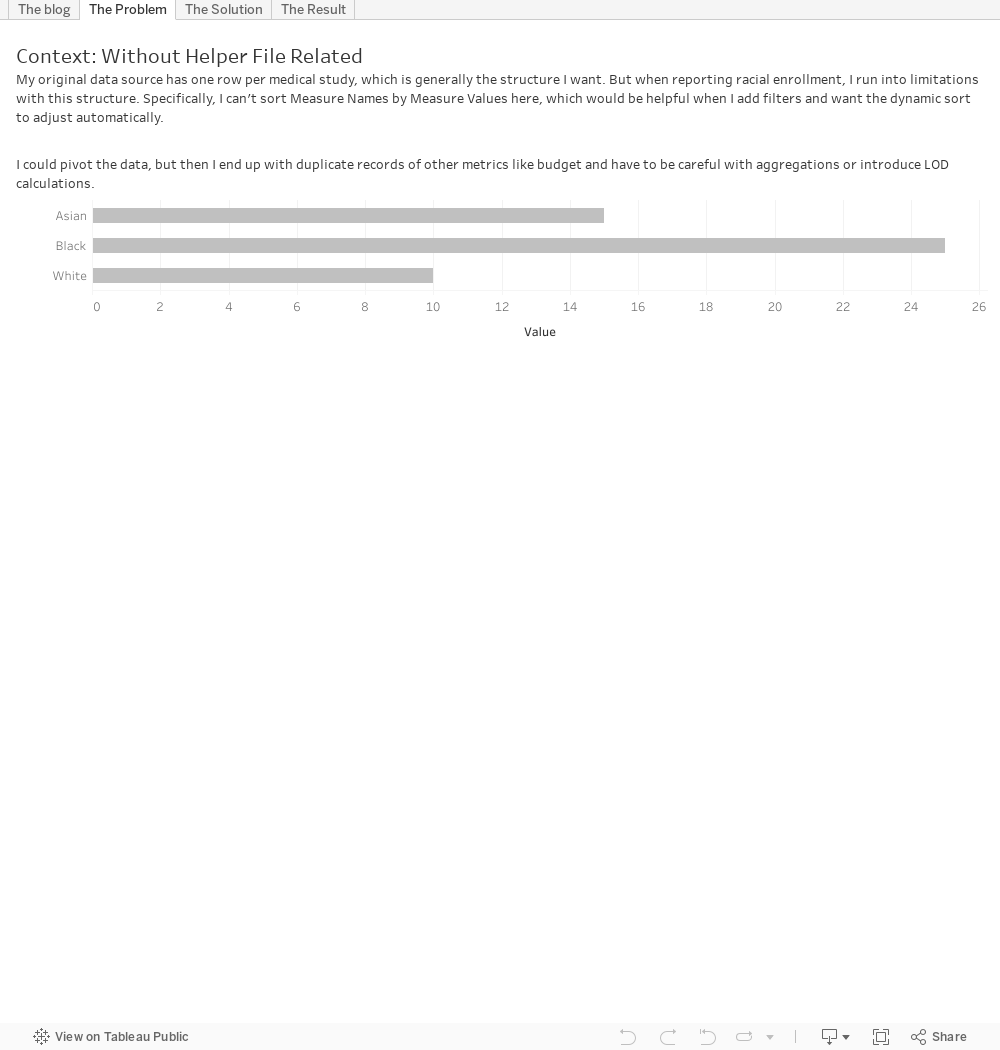
This technique is mostly useful when you need to pivot part of your data, but you don’t want to change the granularity of your data source. In the example I’ll walk through below, it helped me sort Measure Names by Measure Values without pivoting my data.
Note: You’ll need to be using Tableau 2020.2 or later since this technique requires Tableau’s new relational data model.
What’s the basic solution?
With a simple helper file and a CASE statement, you can mimic the structure of a pivoted data source while retaining the original structure and granularity.
Where did I use this?
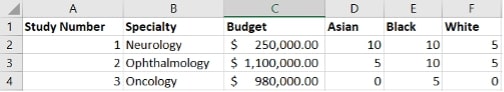
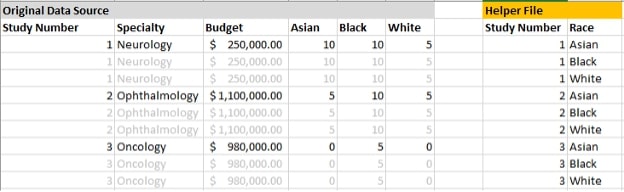
I was working on a project analyzing data about medical studies. My data source had one row per study with a number of different dimensions and measures about each study, including the number of study participants from different racial groups. So something like this:
I included a bar chart in my dashboard showing racial breakdown, but I ran into limitations with sorting. I wanted a dynamic sort by Measure Values that would adapt to filters, but I was limited to an alphabetical sort since you can’t sort Measure Names by Measure Values … or so I thought, until my colleague Carl Slifer showed me the way!
Relationships Unlock New Possibilities
While you can’t technically sort Measure Values by Measure Names, there is a way to mimic it using the new relational data model that Tableau introduced in version 2020.2. All you need is a simple helper file and a CASE statement.
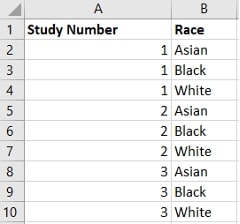
Your helper file should have the same basic structure that you’d want from a pivoted data source. In my case, that meant one row per study and racial group, turning my racial groups into a single Race column, like this:
In Tableau, I then related the original data source to the helper file on Study Number:
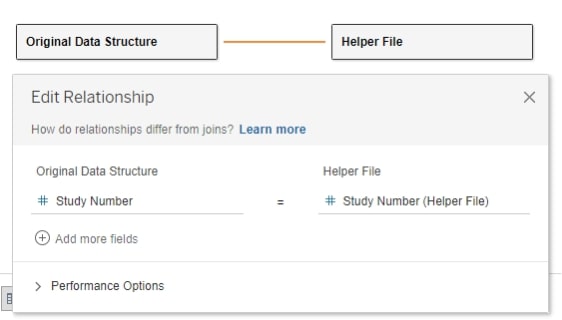
With this relationship, each study in my original data source relates to three different rows in my helper file, but the logical relationship doesn’t physically create the two duplicate records in gray:
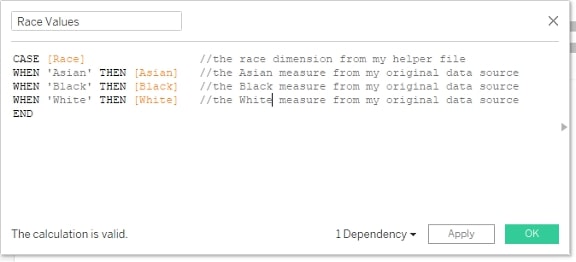
After setting up the relationship, I just added a simple CASE statement. I based it on the Race column from my helper file (which is a dimension with Asian, Black and White as members). And I connected it to the Asian, Black and White columns from my original data source (which are measures showing the number of people enrolled):
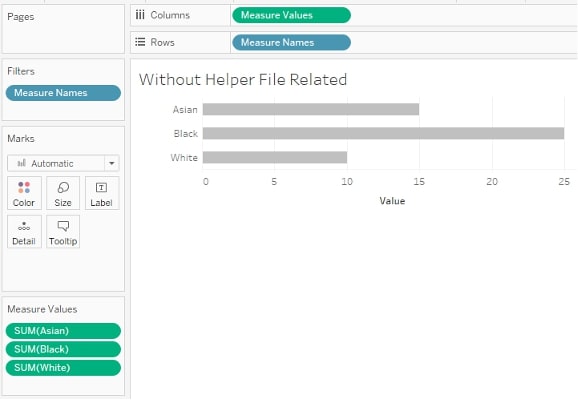
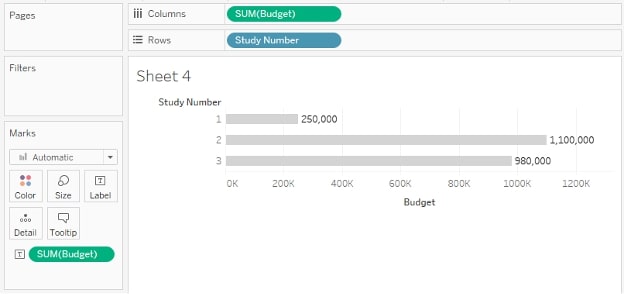
I then built a bar chart with the race dimension from my helper file on Rows and my Race Values calculated field on Columns. The relationship forces Tableau to include each study in each Race row (Asian, Black and White) and draws the right measure from my original data source to show accurate totals:
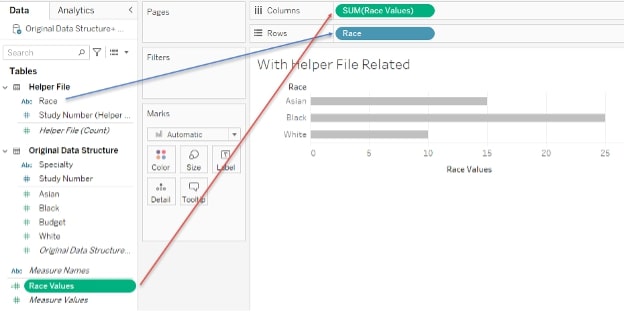
With this calculated field, I can sort the Race dimension by Race Values, effectively mimicking a sort of Measure Names by Measure Values:
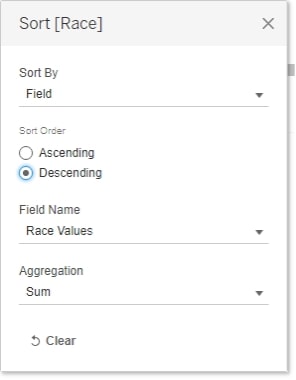
The sort is dynamic, so it adapts to filters (rather than the fixed alphabetical sort that I was limited to with the original data source).
As an added bonus, while a physical pivot would have repeated each study budget three times (see below), forcing me to be careful with my aggregation or introduce level of detail calculations …
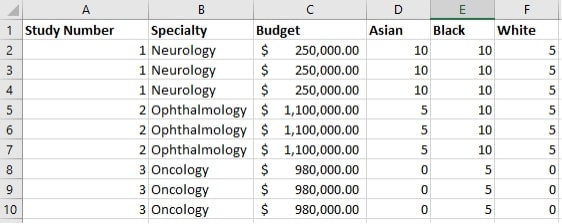
… this “logical pivot” preserves the original granularity (one row per study), so my budgets remain unchanged:
It’s a pretty simple technique that likely has other applications. Reach out to me on Twitter if you can think of other use cases, and feel free to download this sample workbook if you’d like to take a closer look.