
To my surprise, the question of how to manipulate Grand Totals in Tableau arises quite frequently. Most times when it comes to Grand Totals, it is about tinkering with a table or plot so that it will show the most valuable output for the user. So, if you have had this problem or are currently dealing with it, let’s jump into the solution. Below are the quick steps, followed by a detailed explanation that covers the “why” behind all of this.
Quick Steps: What to Do
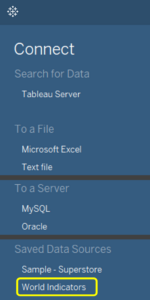
Let’s use Tableau’s World Indicators dataset, which is part of every Tableau Desktop installation:
Then, we need to build out the view with our metrics:
- Drag CO2 Emissions on text.
- Drag Year on Rows and Country on Columns to build a table.
- Add a table calculation (percent of total, over Year of Year).
- Add Grand Total for Columns.
Next, build the absolute metrics for Grand Total:
- Create a calculated field and use the SIZE() function:
IF SIZE() = 1
THEN SUM([CO2 Emissions])
ELSE SUM([CO2 Emissions]) / TOTAL(SUM([CO2 Emissions]))
END
- Drag the created field onto Text.
- Adjust the table calculation (compute over Year of Year).
- Change the created field’s default format to Percentage.
- Change the created field’s Grand Total format to Number.
Do that (or a little variation of that) and you will get one of these:
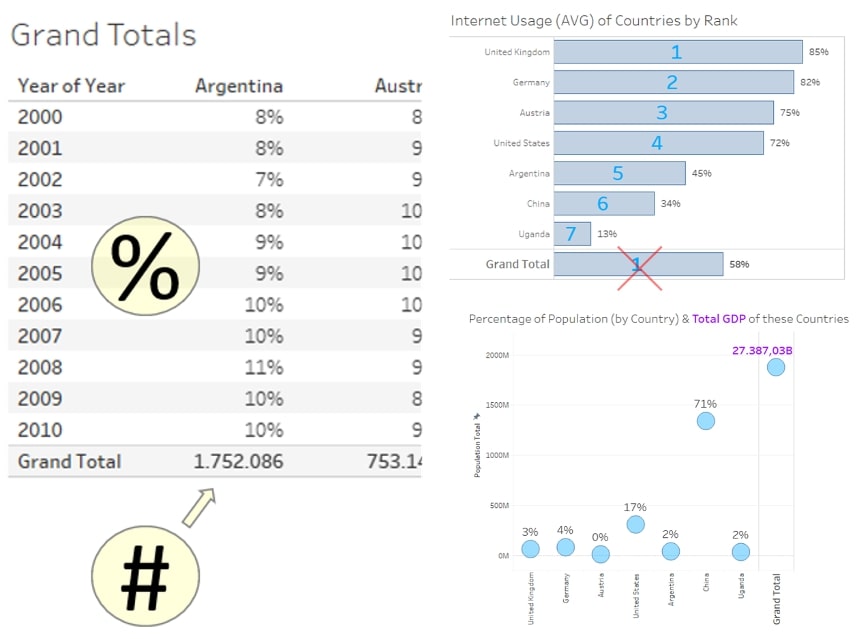
Above: Manipulating grand totals!
Woah, Wait! What Problem Did We Just Solve?
Grand Totals are their own entity in Tableau. We can format them, choose among the four default aggregations of SUM, AVG, MIN and MAX, and—if we are really in for it—we can add Sub Totals and do the same stuff. That’s it.
But what if we want more? What if we want to assign a different number type to our totals or have the Grand Total calculate something completely different than all the other marks in our bar chart?
There, it gets a bit tricky, and we definitely need at least one calculated field to go around that. And before we dive into our solution, let’s look at one other reason why we are doing this: we are not keen on working with LODs (at least not here). Of course, we get where we want using a Level of Detail construct:
IF COUNTD([Year]) = 1
THEN SUM([CO2 Emissions]) / SUM({ EXCLUDE [Year] : SUM([CO2 Emissions])})
ELSE SUM({ EXCLUDE [Year] : SUM([CO2 Emissions])})
END
This calculation provides more or less a similar logic as our solution below, but it is:
- A bit more complicated (especially when we’re not that familiar with Level of Detail calculations).
- Less intuitive.
- Not as independent because the COUNTD at the beginning depends on a specific dimension.
So, let’s skip this and circle back to our SIZE solution.
Why Does This Work?
Let’s go through this process step by step. First, we created a view with a table that shows the CO2 Emissions for each Country from left to right and for each Year from top to bottom. But in this case, we don’t want to see the absolute numbers. We want to see the relative share for each year with a percentage. So basically, all percentages of one country add up to 100%:
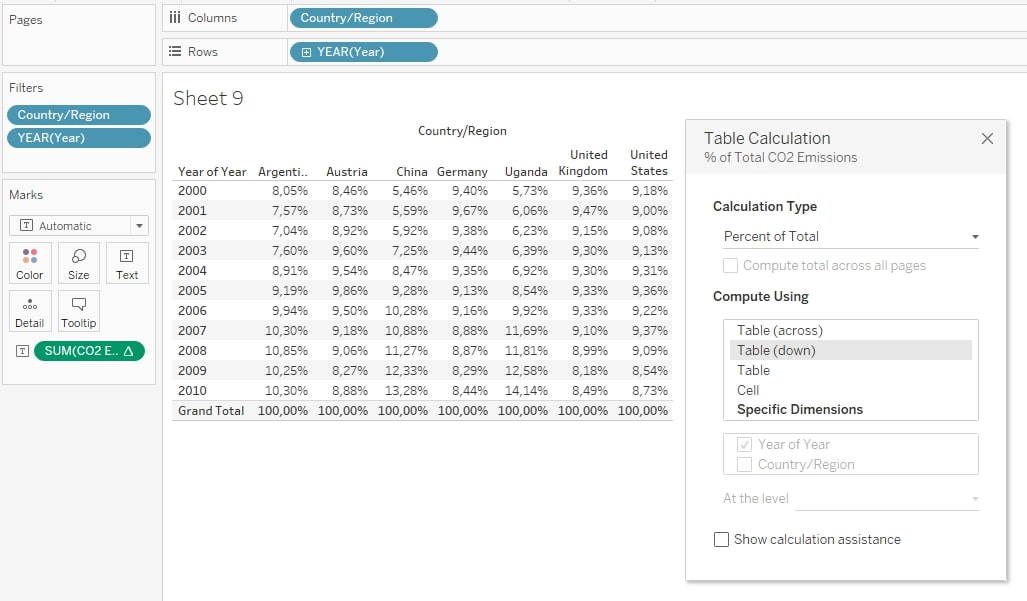
Above: The table calculation (Percent of Total, the computation using the Year of Year) calculates relative percentages for each country. The Grand Totals add up to 100 %.
While the numbers are correct, and the percentages do indeed add up to 100 %, those Grand Totals offer only limited value. They show what we expect, and their only function is to check if the table calculation works properly. (It does; otherwise we would have found a majestic bug within the Tableau software.)
So how do we give these Grand Totals something more to do? In our example, we want the Grand Totals to show the real values, the absolute numbers: The sum of all CO2 emissions for each country over the years. Lo and behold, the might of one of Tableau’s helper functions: SIZE( ) .
This function is not the best known or most popular function, but I think it is heavily underrated. What does it do? Officially: It returns the number of rows in the partition. Unofficially: It counts the cells of a table. (For our Excel junkies: I merger of the Excel and Google Spreadsheets functions COUNTA and COUNTBLANCS.) It is a table calculation (like the other helper functions INDEX, FIRST and LAST), so we have to tell Tableau in which direction we want it to determine the size of the table. Let’s take our example from above and replace the CO2 Emissions with a calculated field that contains just SIZE():
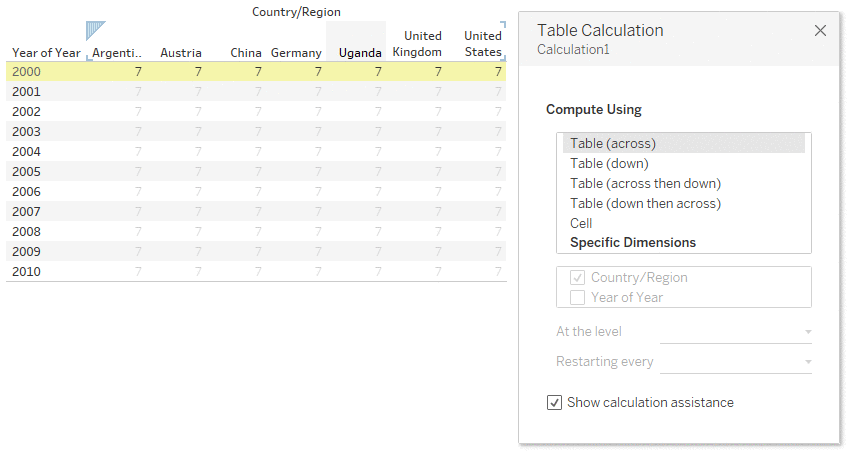
Above: The SIZE function returns seven cells from left to right, 11 cells from top to bottom and 77 cells overall when we let the table calculation count the whole table.
But how do we use these mechanics for our Grand Totals?
Well, here is the essential info: Totals and Grand Totals constitute their own partition. For the SIZE function, they are basically another table glued to the main table. So, if we let the function count cells from top to bottom, it will find 11 cells for our table and 1 cell for the Grand Total:
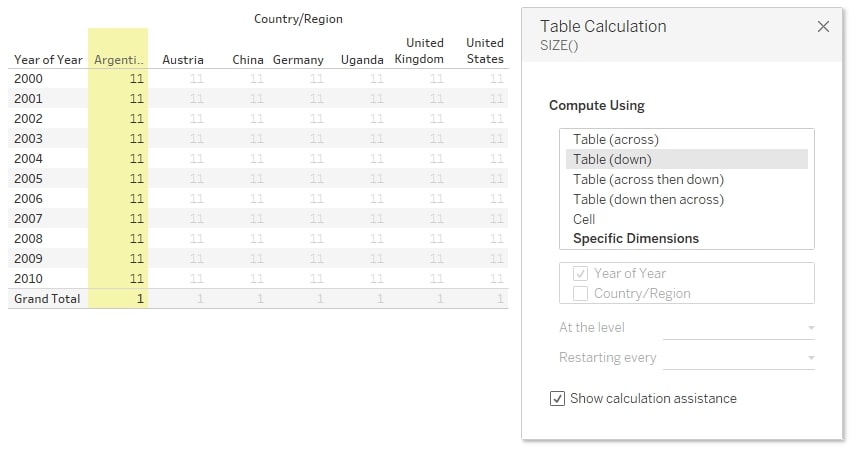
Above: The Grand Totals are their own partition and have their own cell count. Here: 1.
And this is what we’re going to exploit in our calculated field! Let’s mention it here again:
IF SIZE() = 1
THEN SUM([CO2 Emissions])
ELSE SUM([CO2 Emissions]) / TOTAL(SUM([CO2 Emissions]))
END
We tell Tableau to sum up the CO2 Emissions if the SIZE equals 1 – that is only happening in our Grand Totals. And yes, it would also happen, if the table had only one row, but then … would we really need a Grand Total?
If the SIZE does not equal 1, we want to see our table calculation for the percentage. Here, of course, we have to write it out because it is part of a calculated field. Once we have created that field, we drag it onto Text, so it can fill our cells and Grand Totals with the right calculations. An important note: We must not forget to check the direction of the table calculation once we have dragged it there. And we see something like this:
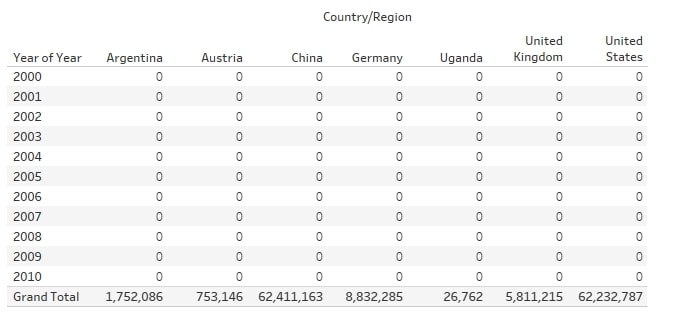
Above: The table shows zeros since the percentages are still formatted as an absolute number and rounded downwards.
Well, we’re not completely done yet, but hey, we got our absolute numbers in our Grand Totals! It worked! Now, we have to wrap the whole thing up and get our percentages back. We right-click on our green pill with our new calculated field (I named it Absolute & relative metrics in the example), choose format and adjust the number formats for our default values AND for the Grand Totals values:
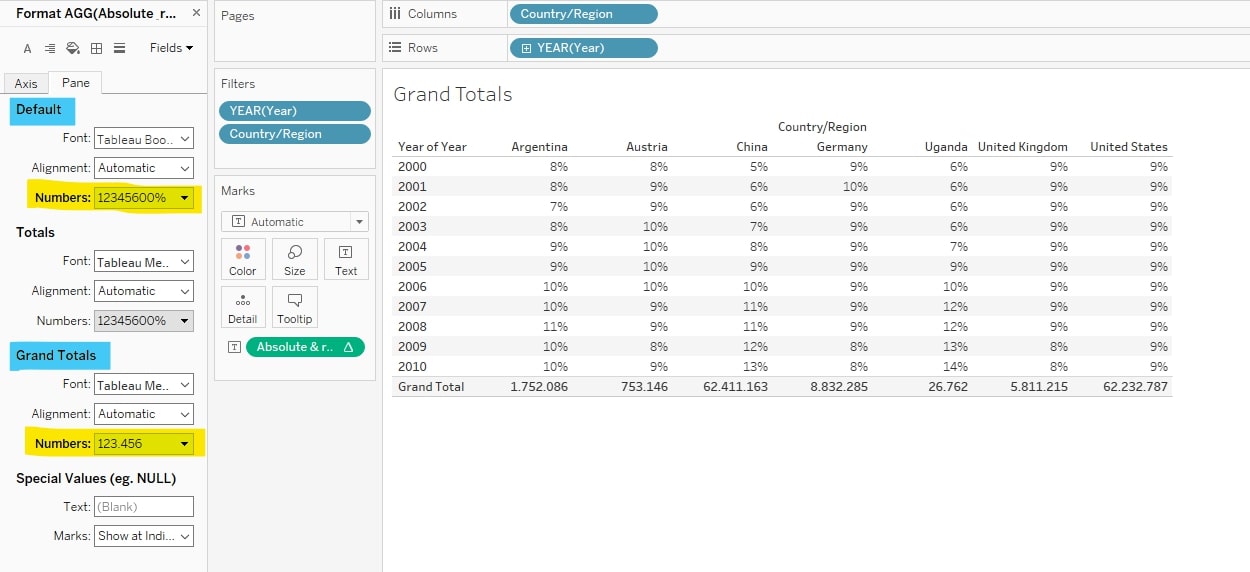
Above: Formatting the default values and the Grand Totals values does the trick. We get different number types, each with its correct format.
Once we have adjusted that, we arrive where we wanted to go: Percentages for each country by year of CO2 emissions and their absolute emissions summed up at the bottom.
Done! I hope you found this post beneficial. Let our team know if there are other ways we can help.