
I’m currently stuck in my house thanks to the COVID-19 pandemic. More than likely, so are you.
Gyms are closed, and social distancing has certainly had an impact on group exercise, so people are having to get creative with the ways they stay active. As the hits on YouTube yoga videos skyrocket, it was suggested that 100 press-ups per day would be a fun, competitive challenge to keep a group of pals active and focused while in isolation.
In order to track my friends’ progress (and, more importantly, their inevitable failure), I set up an automated process using a free applet—no Python coding or any complex configuration required here! This article contains instructions on how you can set this up for yourself and get notifications from your friends to build your own Tableau dashboard based on the data received. Feel free to use my dashboard as a starter by downloading it from Tableau Public!
The Challenge Process
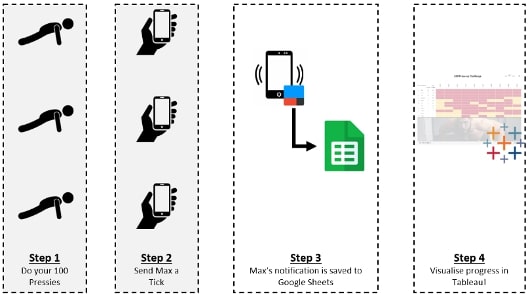
Step 1: Do your 100 pressies.
No getting around this one. It’s the whole point. Any type of press-up is fine. Variation is encouraged. Even if you’re a press-up machine, who knows how long lockdown will last? Mix it up!
Step 2: Send me a tick.
Texting, WhatsApp, Facebook Messenger, Instagram DMs. Doesn’t matter. Anything that gives me a notification can be parsed. To keep things easy on my end, all I ask is for the message to start with the word Tick or ✅. Anything else and you will not be registered. Time zones have been known to be gamed by unscrupulous pressers. They are registered on the date they are received.
Step 3: The notification is saved to Google Sheets.
Using IFTTT, a free applet service that integrates with a huge range of cloud technologies, I have all my notifications sent to a Google Sheets spreadsheet. I can’t recommend IFTTT enough here. It’s easy to use with barely any configuration required. Enter your Google credentials (for Android and Google Sheets) and IFTTT does the rest, using the relevant APIs to get and post your notification strings, including a timestamp, app name and the sender.
Step 4: Visualise progress in Tableau!
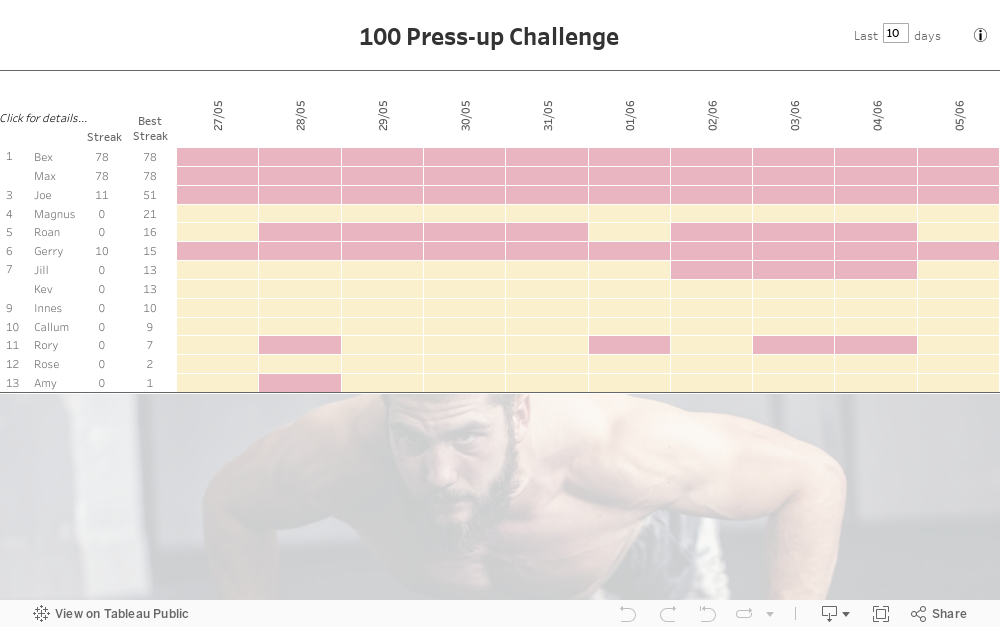
Having an interactive dashboard for your pressers to investigate makes your challenge legit. Tableau Public and Google Sheets are both free, with the added benefit of Tableau Public being able to automatically update from Google Sheets! If you’d like a starter for your dashboard, feel free to use mine by downloading from here:
Creating the Dashboard in Tableau
Finally, it’s important that your user base get the information they need most with ease. In order to design this dashboard effectively, or any dashboard for that matter, it’s a good idea to write down three questions you’re trying to answer:
- Who’s currently on the longest streak?
- Who’s done the most press-ups overall?
- Where am I in the table?
You’ll also have to think of some rules of play here. Our competition is all to do with streak. Total pressies is a nice metric, but if you’re forgetting to send your ticks, you won’t fare well on the leaderboard. It’s also an idea to leverage Tableau’s more fun features, like tooltips and dashboard actions drilldowns, so your pals understand what that “Tableau” thing is all about.
PREVIOUS_VALUE(0)
Since we’re analysing a binary signal (each day every person in the data source either did their pressies or didn’t), table calculations are required to aggregate our findings into helpful metrics. After creating my highlight table showing each date per person, I calculated each person’s streak using the PREVIOUS_VALUE(0) function. This took me a while, I must admit. I was intending to use the RUNNING_SUM() function, but I couldn’t find a way to make it restart from zero every NULL value (a missed day).
Streak
IF ISNULL(MIN([Number of Records])) THEN 0 ELSE PREVIOUS_VALUE(0)+1 END
PREVIOUS_VALUE(0) returns the value of this calculation in the previous row. So it’s self-referential, unlike the lookup function (you can’t LOOKUP( ) your own formula’s value). If the previous row doesn’t exit (ie. you’re in the first row in the partition) then zero (0) will be returned. Perfect. Didn’t do your pressies? No points for you. Start again.
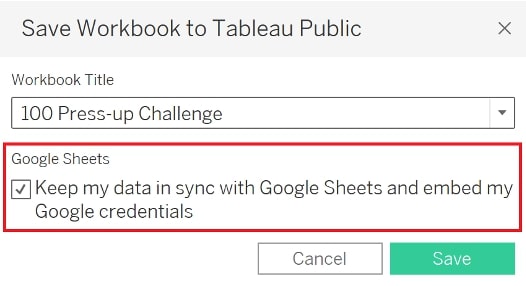
Share Your Own Dashboard to Tableau Public
To publish your dashboard to Tableau Public, click Server > Tableau Public > Save to Tableau Public As (after logging in). Before clicking Save, ensure you have checked Keep my data in sync with Google Sheets and embed my Google Credentials:
I’m sure there are apps out there that give you this functionality, but that’s no fun. Any project, no matter how daft and exhausting, can help get us through this situation we find ourselves in. If it encourages people to move while in isolation, as well as forces daily communication between pals, I’m all for it.
Please leave a comment to let me know of any alternative solutions you’ve found to track your progress in similar challenges! Stay safe.