I recently built a dashboard to help a company see progress towards targets. The client needed a broad yet granular overview that allowed them to quickly scan across their business and spot areas of concern for further analysis.
The Challenge
Bar-in-bar charts ended up being the most intuitive way to visualize the data, but there were a LOT of bars to display. Users also needed a number of different ways to slice and filter the data, but I didn’t want to sacrifice any space on the dashboard for these setting options. I wanted to give the bar charts as much screen space as possible.
The Solution That Didn’t Quite Work
At first, I used Tableau’s show/hide container to build a sidebar with all the filters that could be expanded or collapsed. But when a few users tested it out, they didn’t like the fact that you had to click the icon to show the container and then click again to hide it. They wanted it to expand and hide the container when you hovered. Unfortunately, that’s not an option yet in Tableau, but I’ve added this to the Tableau ideas forum, and you can vote for it here.
The Workaround
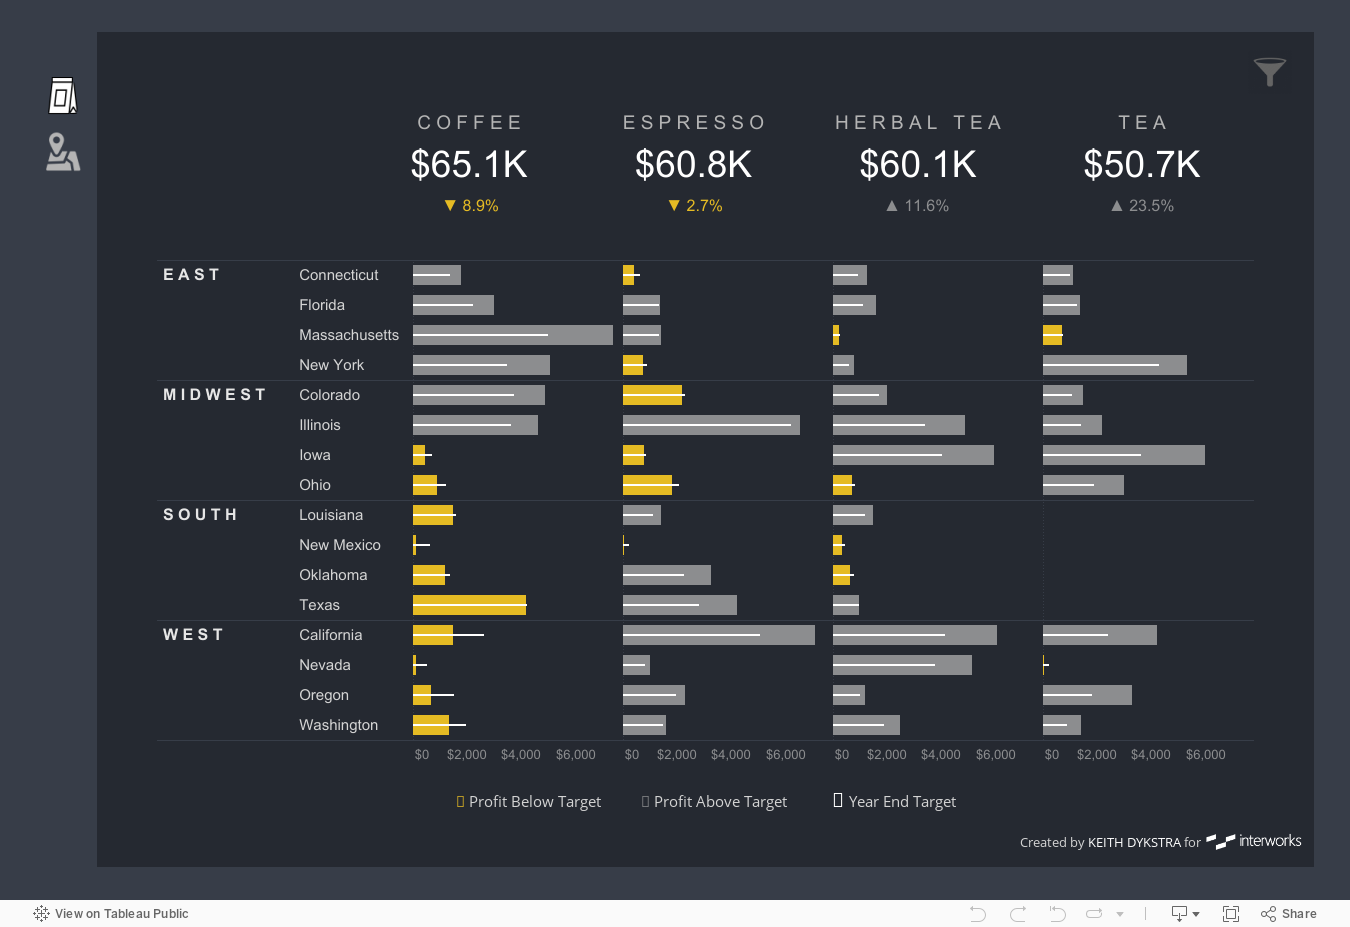
The request prompted me to experiment with parameter actions, and I discovered a way to create a sidebar that expands and collapses on hover. Unfortunately, it only works for worksheets, so I couldn’t use it to hide the container with the filters. I’ll describe the technique below (it’s surprisingly straightforward), but below is a preview of where we’re going. The filters on the right side can be shown or hidden by clicking on the icon (using the show/hide container feature), while the sidebar on the left expands and collapses upon hover (using the technique I’ll describe below).
The Steps to Create the Sidebar
There are just four things we need to create this auto-expanding / auto-collapsing sidebar:
- Calculated fields set to the values 0 and 1
- A parameter with the values 0 and 1
- A filter attached to the sheets that we want to expand and collapse
- A parameter action that controls the value of the parameter we set up in step 2
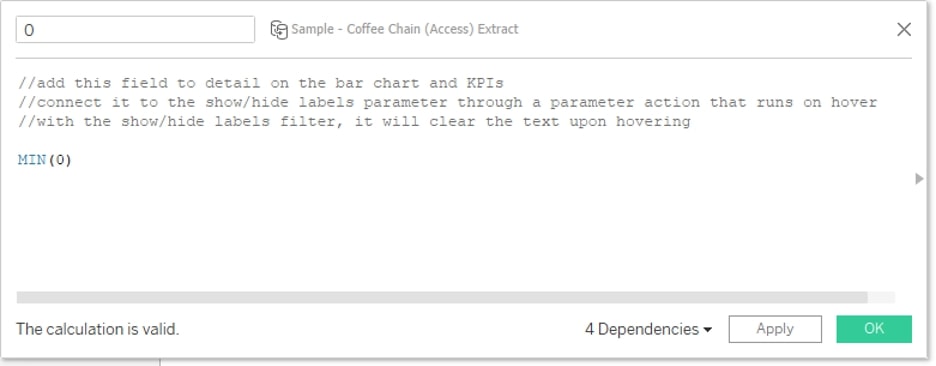
Step 1 is as simple as it sounds. Create a 0 field by typing MIN(0) and a 1 field by typing MIN(1):
There’s kind of a step 1.5, which is to add these 0 and 1 fields to certain sheets. That may be a little hard to understand before we’ve gone through all the steps, but I’ll explain it now. If it doesn’t make sense, read through the rest of the steps and then come back to this part.
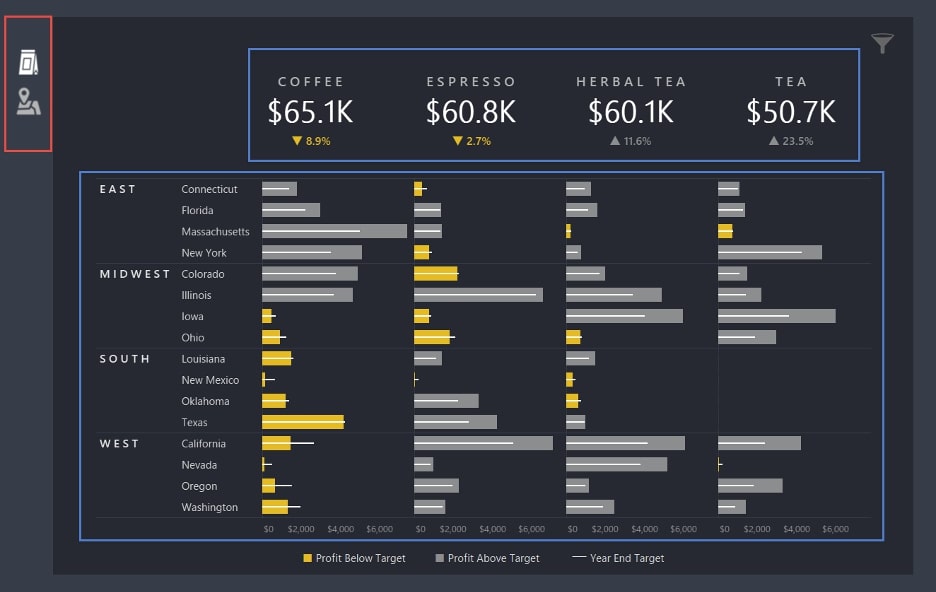
Eventually, we’ll create a parameter action to show the sidebar when we hover over some sheets and to hide it when we hover over others. You’ll need to add the 1 field to any sheets where hovering should expand the sidebar. Add the 0 field to Detail on any sheets where hovering should collapse the sidebar. In the example below, the sheet outlined in red has the value 1 on Detail (hovering over that sheet expands the sidebar). The sheets outlined in blue have the value 0 on Detail (hovering over them collapses the sidebar).
Note: Under some circumstances, you can do this step using ad-hoc calculations instead of calculated fields. I’ve included a note at the end of the article about when that works and when it doesn’t.
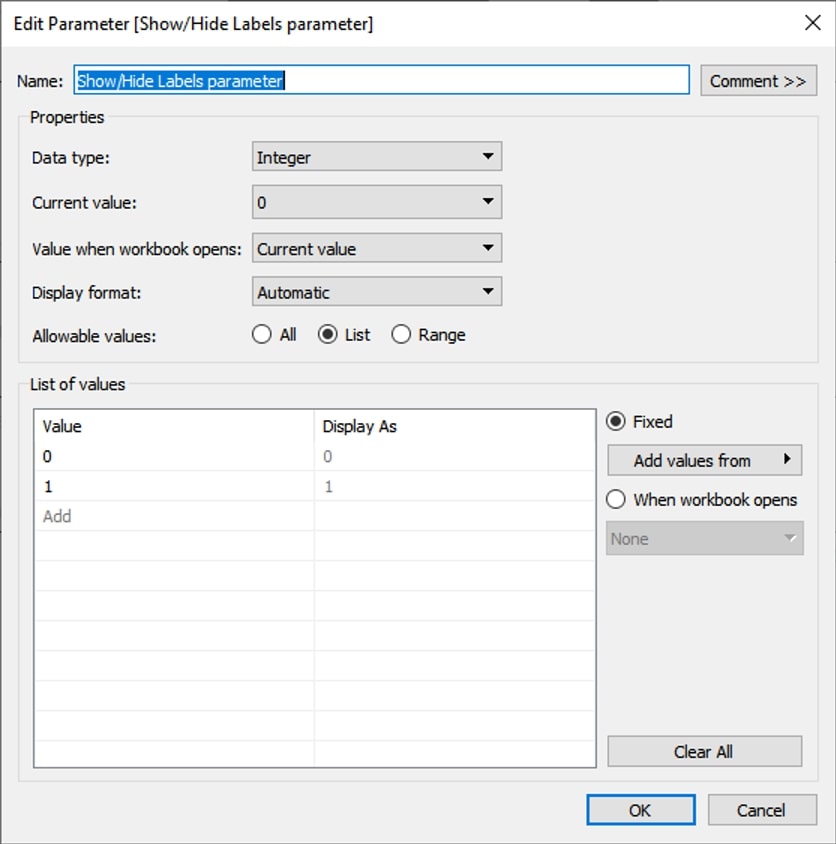
Step 2 is also as simple as it sounds. Create a parameter, with Data type set to Integer and a list of options that includes 0 and 1:
In Step 3, we create a filter that will be connected to the parameter we just built. It’s also very straightforward: just type the name of the parameter you created in step 2, and specify that the parameter equal 1. I’ve included a bunch of notes in this calculated field, which I’ll explain below, so you don’t need to read it all now, but it may help if this is all sounding a little strange:
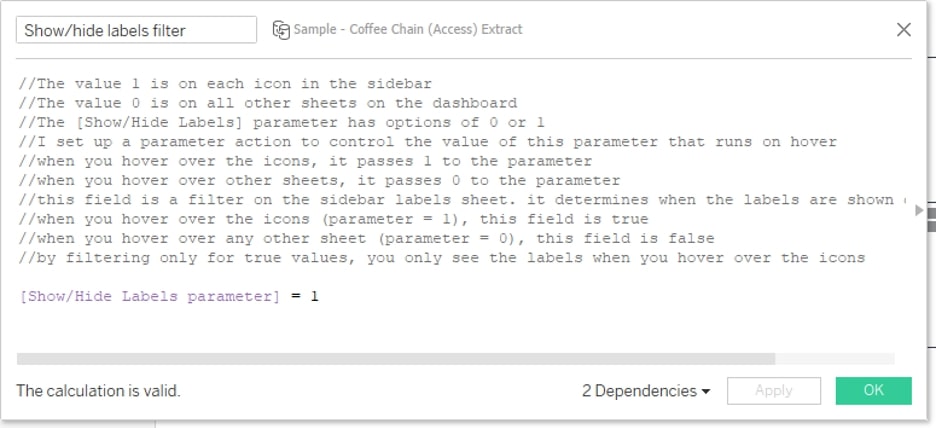
The calculation above will create a Boolean (true/false) field. It will be TRUE when the Show/hide labels parameter equals 1. It will be FALSE when the show/hide parameter equals 0. (In the next step, we’ll create a parameter action that controls when the parameter equals 1 or 0.) Place this filter on any sheets you want to automatically expand or hide, and select True in the filter dialogue box:
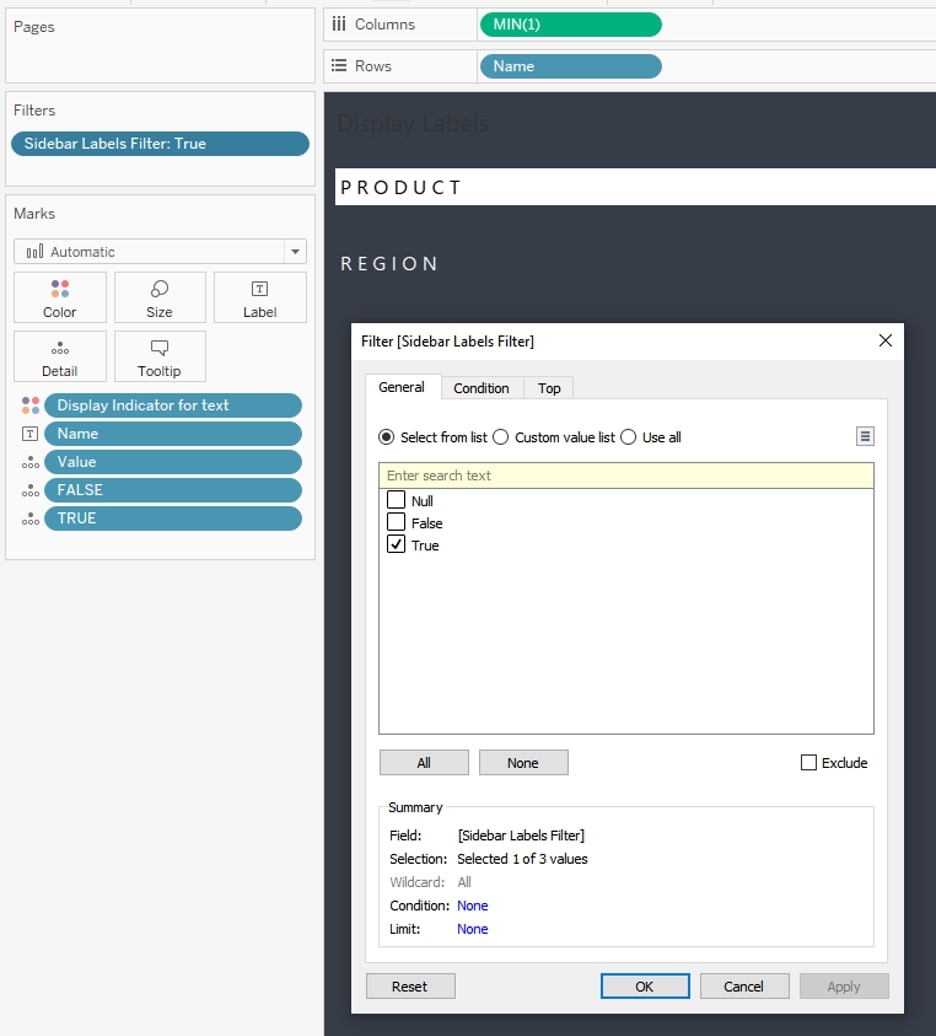
I placed this filter on a sheet that had labels to describe my sidebar icons (Sheet 2 in the image below), as well as a map that I added to the expanding sidebar for context (Sheet 4):
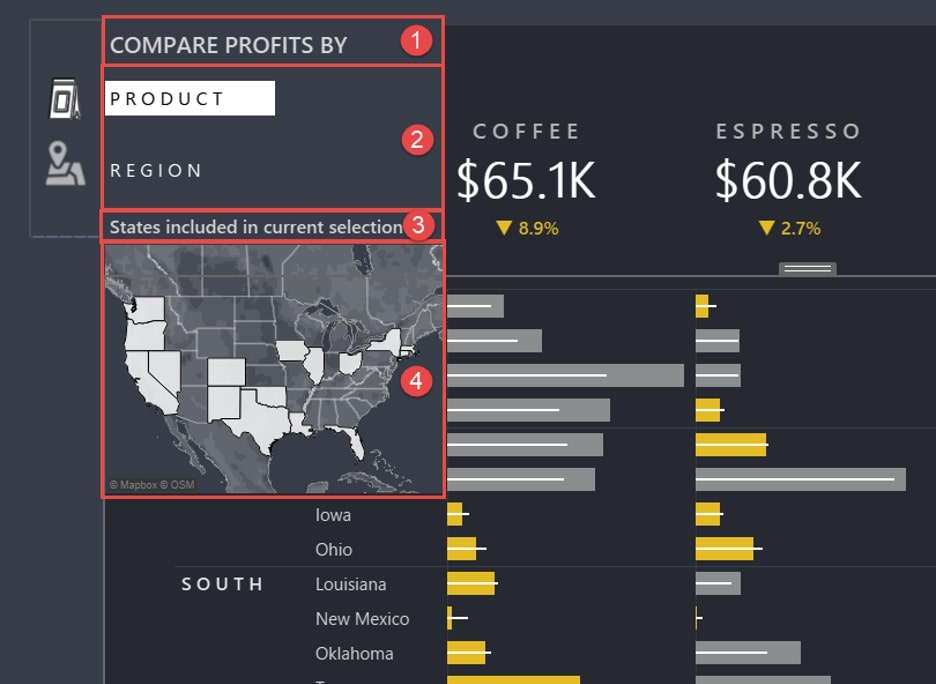
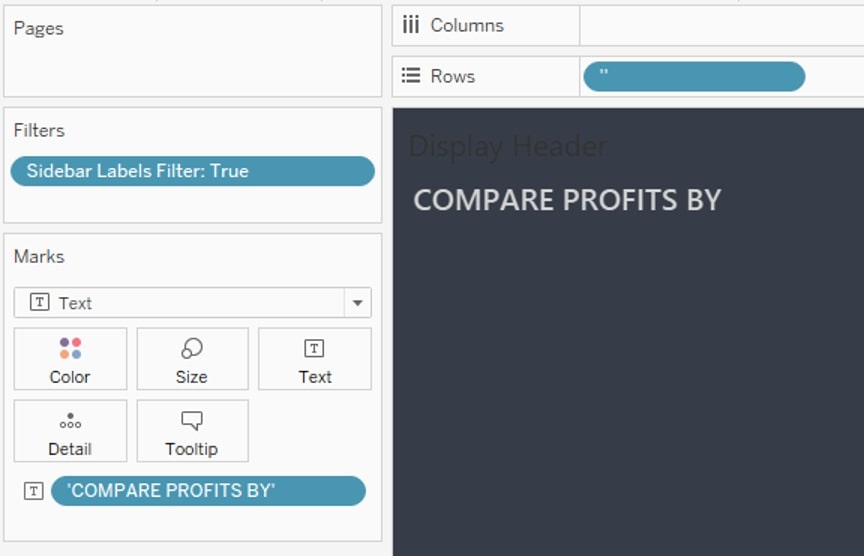
You’ll need to hide the titles of any worksheets that you include in the expanding sidebar because the titles won’t clear even when the filter is false. So if you need titles for things in the expanding sidebar, like I did, you’ll need to set those titles up as separate sheets with your title on text (that’s what sheets 1 and 3 are).
You can do it quickly with a simple ad-hoc calculation: Just double-click in the Marks card and type the text that you want to appear. In order for the sheet to fully collapse, you’ll need something on the Rows or Columns shelf, so I just double-clicked and typed an open and closed quotation mark to make a blank ad-hoc calculation. You can technically put any field on Rows that only has one value and hide the header:
When I said there were four steps, I was assuming you already had your dashboard set up, so take a second to do that if you haven’t yet. I should be clear about one thing that might cause you trouble with your dashboard setup. I tiled my bar chart, KPIs and icons, and then I added a floating container that held all the sheets I wanted to show/hide on hover. Set your show/hide parameter to 1 to display the contents of these sheets to make setting things up easier. Also, note that the floating container has to be on top of the tiled elements behind it. Even when it’s collapsed, it will float a blank sheet on top of the tiled elements, which will prevent users from clicking on the sheet behind it, so you may have to rethink your dashboard layout a bit or resize this floating container.
Seeing It All Come Together in Tableau
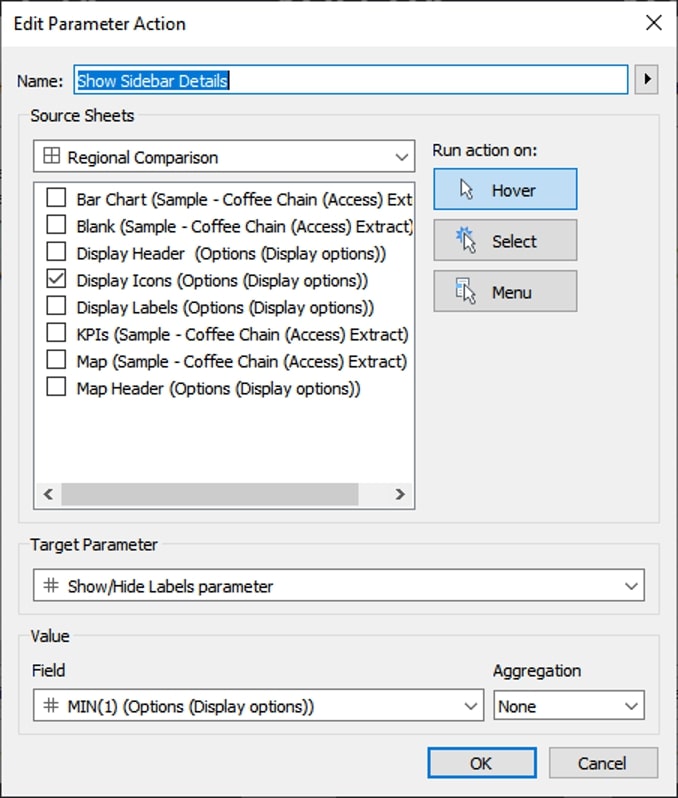
Step 4 is where all the magic happens! Create a parameter action on your dashboard that will expand the sidebar. Run the action on hover, and select the sheets that should cause the sidebar to expand. Target your show/hide parameter with the field MIN(1). Choose no aggregation—if you have multiple records and you choose the SUM aggregation, the value could end up being greater than 1, and your action won’t work.
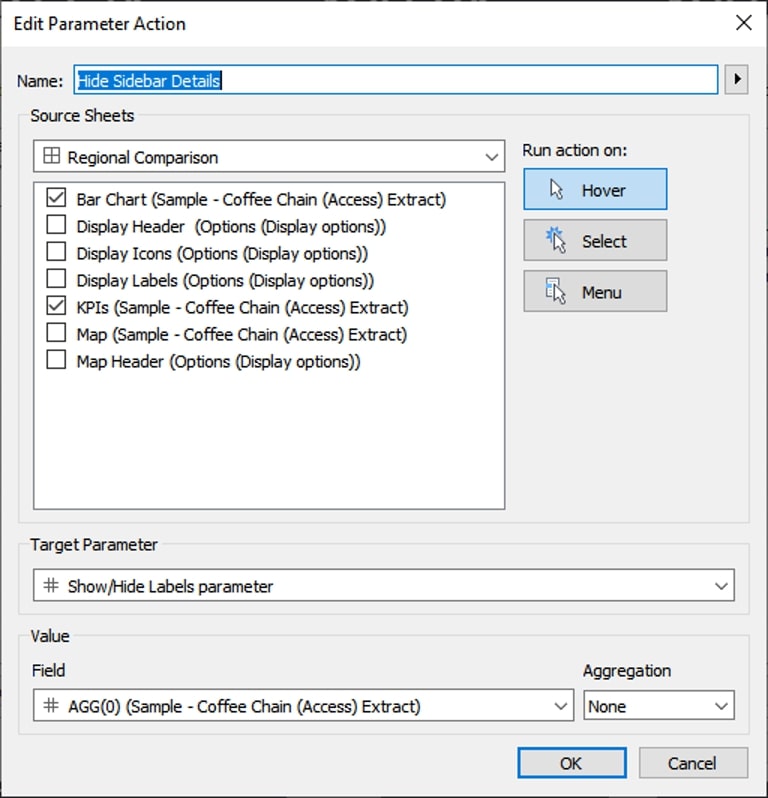
Next, create a second parameter action that will hide the sidebar. Run this one on hover as well, but connect it to the sheets that you want to clear the sidebar. Target the same parameter, but this time, use the 0 field with no aggregation:
That’s it! Now you should have a sidebar that expands when you hover over the far-left sidebar and automatically collapses when you move off of it. I’ve included a few additional notes below. You may want to check out the one about a complication you might experience if you publish something with this technique to Tableau Server or Tableau Public. Unfortunately, it doesn’t render quite as smoothly as you experience in Tableau Desktop, but please comment below or find me on Twitter (@keith_dykstra) if you find a way to improve the technique!
A Note About Complications When Publishing to Server or Public
When I published this workbook to Server, the experience wasn’t quite as smooth as what you see in the GIFs. Every time you hovered over a different bar in the chart, the viz briefly froze and faded and then returned. Since the filter for the sidebar was attached to a hover action for the bar chart, each hover over a new bar triggered the filter, which I believe is what caused the brief delay. I ended up disconnecting the bar chart from this dashboard action and placing a small blank container just outside the expanding sidebar, which I connected to the dashboard action instead. It’s not a perfect solution—If you quickly move off of the expanding sidebar directly to the bar chart, the sidebar may get stuck since the bar chart no longer collapses the sidebar. But a slightly slower move from the sidebar to the bar charts will register a hover over the blank container, triggering the collapse action. Hovering over the KPIs still collapses the sidebar as well.
A Note About Creating Clickable Icons to Change Your Display
If you want to know more about how clicking the icons changes the display, you can download my full workbook here. It’s a pretty simple case statement along with another parameter action that changes the fields on Rows and Columns based on the icon you click. You can find another blog I wrote about the steps here, but in this example, I used sheet swapping to change the display instead of simply swapping the fields on Rows and Columns.
A Note About Using Calculated Fields or Ad-hoc Calculations
Originally, I added 0s to my sheets as an ad-hoc calculation (just double-clicking the Marks card and typing the number 0). But ad-hoc calculations are unique to each sheet, so I ended up with multiple MIN(0) fields since I had multiple sheets that could be used to clear the sidebar (the bar chart and the KPIs):
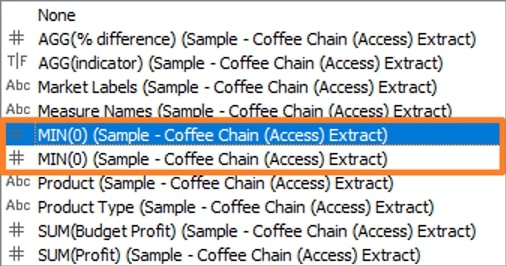
Even though both sheets have a MIN(0) calculation on them, Tableau treats each as a separate field, so I got an error message that one of the sheets was missing the MIN(0) calculation (the one from the other sheet):
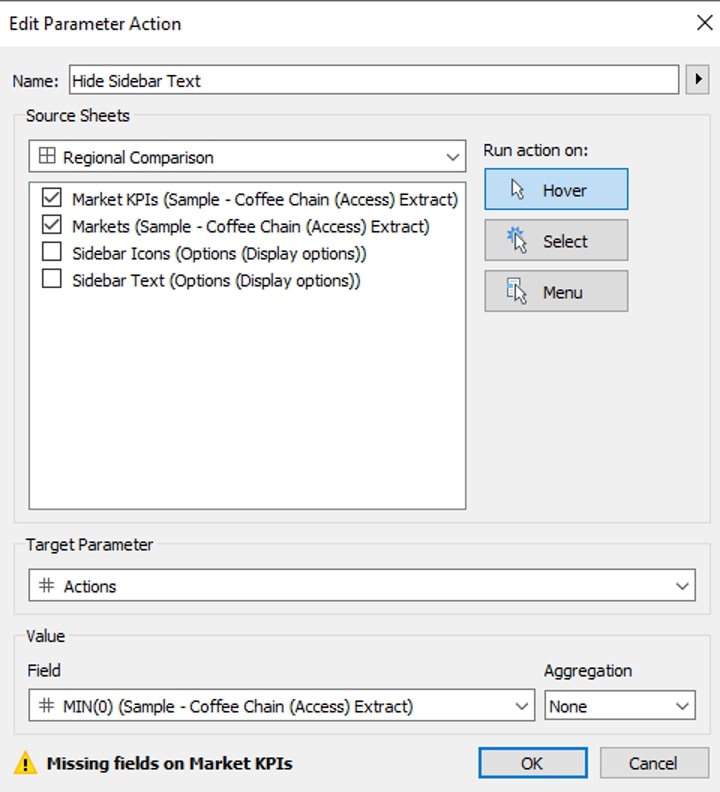
That’s why my steps advise you to set up your 0 and 1 values as calculated fields, so you can use the same field on all your sheets and avoid having to set up multiple dashboard actions.
If you download my workbook, you’ll notice there is no calculated field for the value 1. That’s because the only sheet that causes the sidebar to show when you hover over it is the sheet with the icons. Because there is only one sheet needed for this parameter action, I was able to use an ad-hoc calculation on that sheet.
TL;DR: You can use ad-hoc calculations to create your 0 and 1 values if you’ll only be placing those values on Detail on one sheet. If you need them on more than one sheet, create a calculated field.
Give It a Go!
I hope this process is helpful for you and shows you creative ways to use things like parameter actions to build more convenience into your dashboards. Remember to vote for this feature on the Tableau ideas forum if you’d like to see it integrated there, and let me know how this workaround goes for you in the comments. Here’s the full viz, so you can see the final product. Best of luck!