My colleague Kendra Allenspach and I recently put together a visual story about InterWorks’ musical preferences using Spotify Wrapped data (we’ve embedded the final product at the end of this article if you want to skip straight to the fun stuff). The project took us outside our normal Tableau boundaries as we experimented with Tableau’s new Viz Animations feature and parameter actions. Through some trial and error, we discovered a unique way to tell the story that felt less like a traditional dashboard and more like an interactive experience.
Parameter Actions for More Interaction
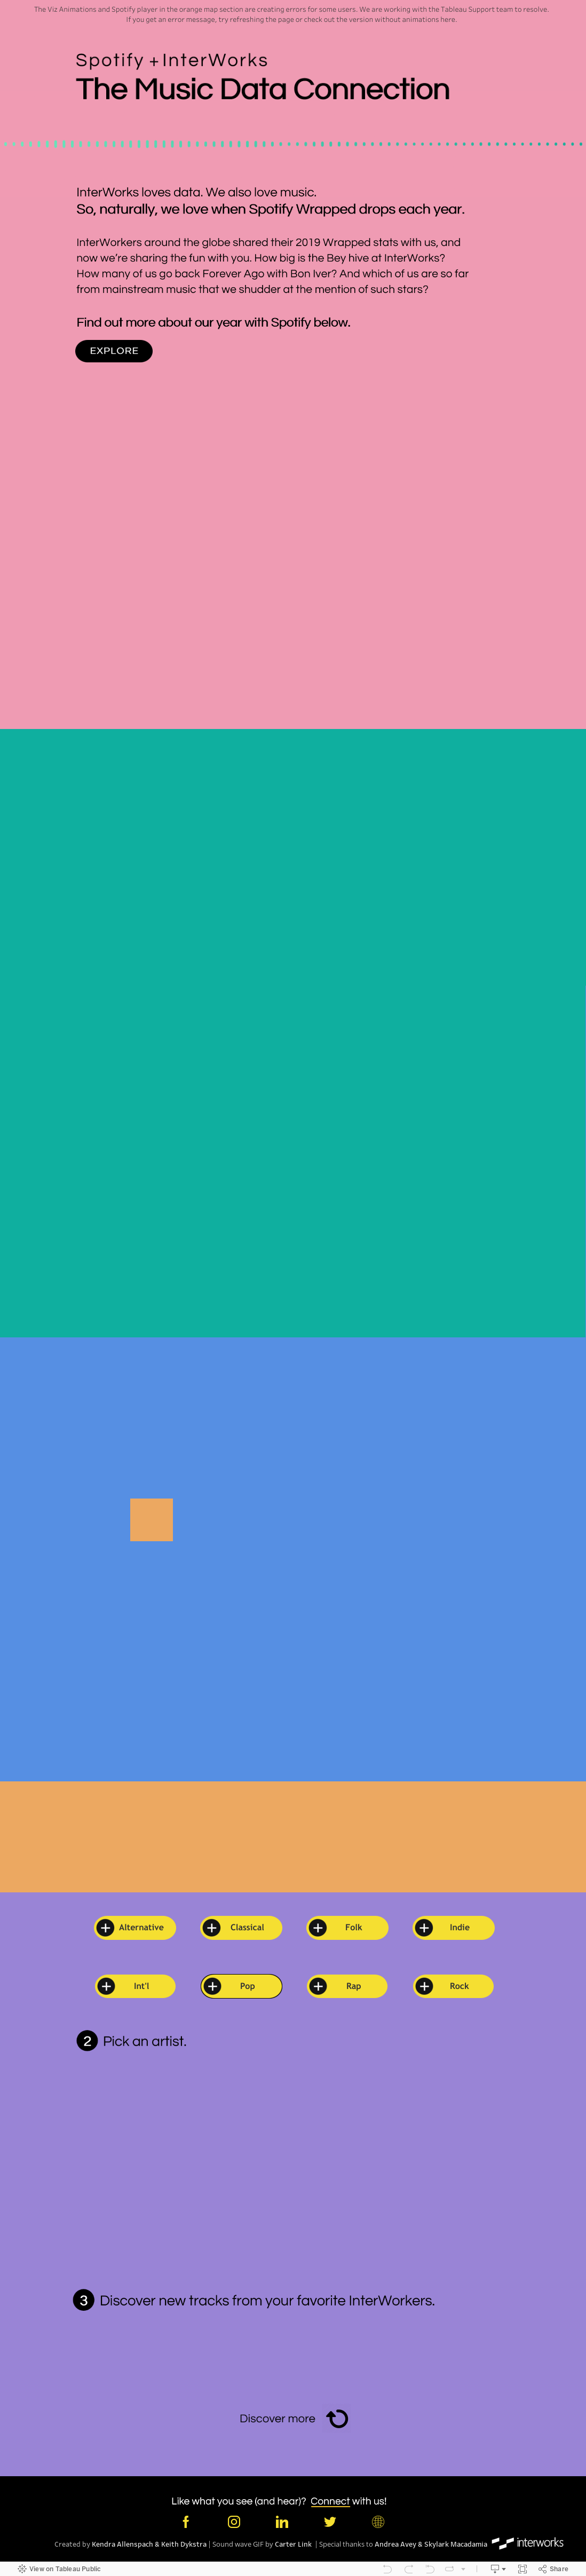
Much of our work builds upon techniques other people had already discovered, but I’ll walk you through a few of the things we figured out along the way. In case you haven’t seen the project yet, here’s a preview of where we’re heading:

In this article, I’m going to focus on how I built the line that runs down the viz with clickable shapes. As you click on each shape, the dashboard gradually reveals the next point, like this:
The basic technique I used is originally from Ken Flerlage. He wrote about creating a counter (along with some other great parameter action tricks) here. The process is pretty simple, so I’ll reiterate it below, but be sure to check out Ken’s blog for some other cool ideas.
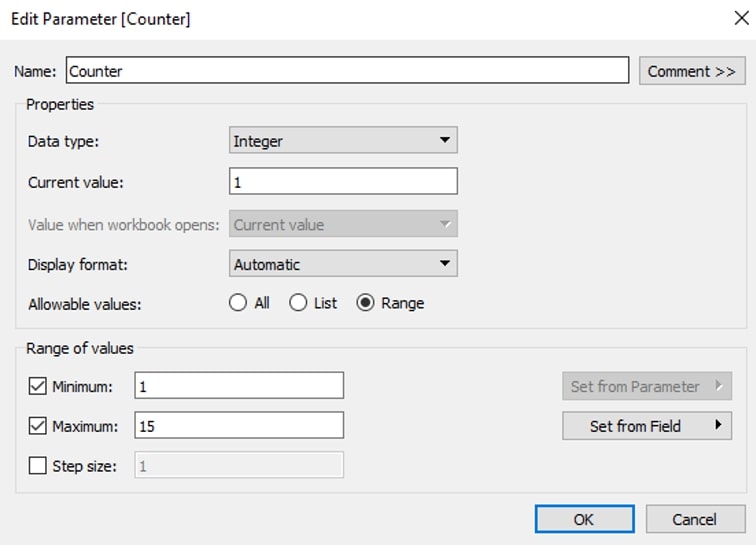
Step 1: Create a parameter with Integer as the data type. I set a range of possible values based on the number of story points in my dashboard:
Step 2: Create a field that can be used to increment the parameter by 1 each time you click. Place that field on detail on the sheet that users will click to increment the counter:
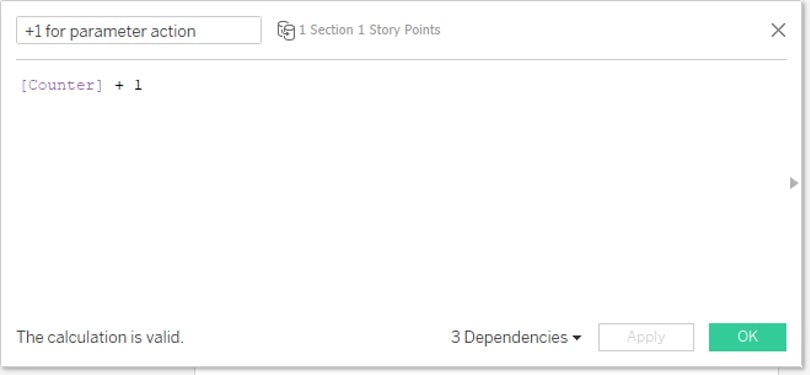
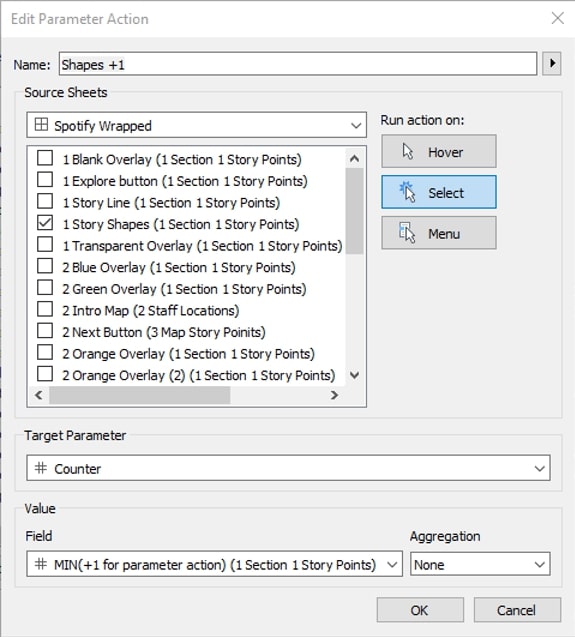
Step 3: Add a parameter action to your dashboard that uses this sheet as its source and targets your counter parameter with the +1 calculated field you created in the last step:
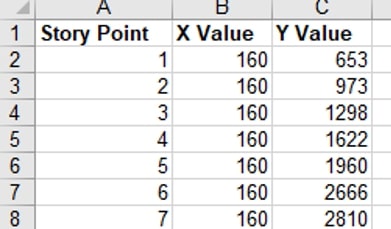
That’s all you need to do to create a counter that gradually increments. For my dashboard, I added some additional layers, though. I wanted the shapes to be hidden at first and gradually revealed with each click. To accomplish this, I created a data source with a record for each point in the story. I also figured out the exact X and Y positions I wanted for each button (not necessary if your points will be evenly spaced, but mine weren’t):
Then I wrote an if/then calculation to control when the points were displayed, based on the value of the counter. I repeated this calculation for the Y value as well and then put those fields on rows and columns:
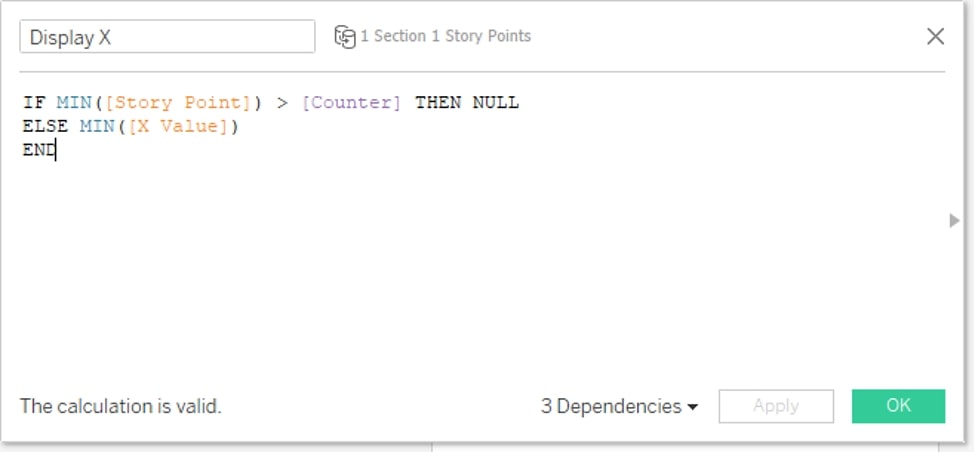
With the formula above, when the Counter parameter value is 1, story points 2 -7 are greater than the counter. Their X and Y values are null, so they don’t display. As you click the first story point, the parameter value changes to 2. Now, points 1 and 2 display (because they have non-null X and Y values), but points 3-7 are still hidden (because their X and Y values are still Null). Each time you click a shape, the parameter value increases, displaying the next story point, like this:
You may have noticed that as you click, not only does the next shape appear, but the previous shape changes from a + sign to a ˅. I did this to help the user understand where they should click next. It just required an extra field that distinguished the current point from previous points:
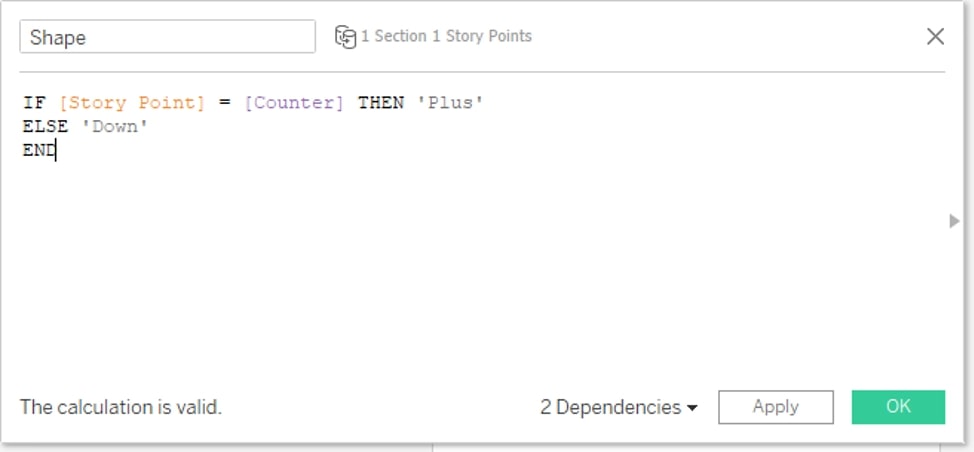
Add that field to Shape, and you can then choose the shapes you want to represent the current point and previous ones. I also added a line behind the shapes and turned the viz animations on to gradually connect each button. That line uses basically the same setup as the sheet with the shapes (X and Y values that are null until the story point is less than the counter), but the mark type is set to line instead of shape.
More Tableau Tips on the Way
I’ll write a separate post about how I added animated elements that work in conjunction with these parameter actions, so check back soon!