Tableau and Salesforce have teamed up, great! What next? Are you excited about Tableau now being a part of Salesforce but unsure about how to utilize this?
What Is Tableau?
If you are already a Tableau user, you know what a great visualization tool it is. If not, you can find out the basics on the Tableau website. In short: Tableau is InterWorks’ only data visualization partner. This robust platform is the premier solution when it comes to visualizing your data insights.
If you are not currently using Tableau to look at your Salesforce data, now is the time to start. With the recent acquisition, it has never been easier to use Tableau to look at your Salesforce data. Why is this a good thing? Because Tableau will allow you to blend Salesforce data and other types of data to give you a deeper understanding of your Marketing, Sales and Services efforts. Additionally, Tableau allows users—even if not Salesforce CRM users directly—to view snapshots of reports and dashboards on the relevant data. Plus, a well-designed Tableau dashboard makes your data easier to read and view at-a-glance information for anyone.
How Can Tableau Improve Your Salesforce Organization?
The benefits of adding Tableau to your Salesforce organization are vast. How you use it will depend on your company, your users and what data you have. Every company will have different needs, and every user may have a different way of working, which means some kinds of information are more helpful than others; therefore, some features will be more useful than others. You will have the ability to see data, not only that which is entered into your Salesforce CRM system directly but also whatever other sources of data or integrations you are using. You can then put all that information into an easy-to-read visualization available to all your users, and they can even subscribe to it, taking a huge chunk out of your day if you have “check-in” meetings that require stats on how your business is doing. This reporting can help managers see how their team is doing at a glance, help answer questions when discussing a project or case with a client and help individual users prioritize their tasks. There are limitless possibilities.
What’s New Since the Merger?
To give you a headstart, Tableau has released some out-of-the box dashboards to get you started. Though the functionality to use Salesforce data as a dataset has existed for a number of years here, the merger means there are now also many online resources to walk you through connecting to Salesforce or any other datasets you may want to use. It is as easy as logging into Salesforce.
Once you’ve created and published your dashboard, you’re ready to embed it into your Salesforce organization. There are many options for how to embed dashboards. This blog illustrates the technical part of how a Salesforce Admin can set this up for you. In the examples below, I will be using Visualforce pages to pull in published dashboards.
Put a Dashboard (or a Few) on Your Home Page
This is best for any big overview reports or dashboards. The best are visualizations that answer questions like:
- “How is my quarter (or my team’s quarter) going so far?”
- “What is our projected revenue for next quarter?”
- “How quickly is my team answering calls (or any other metric that is important to me)?”
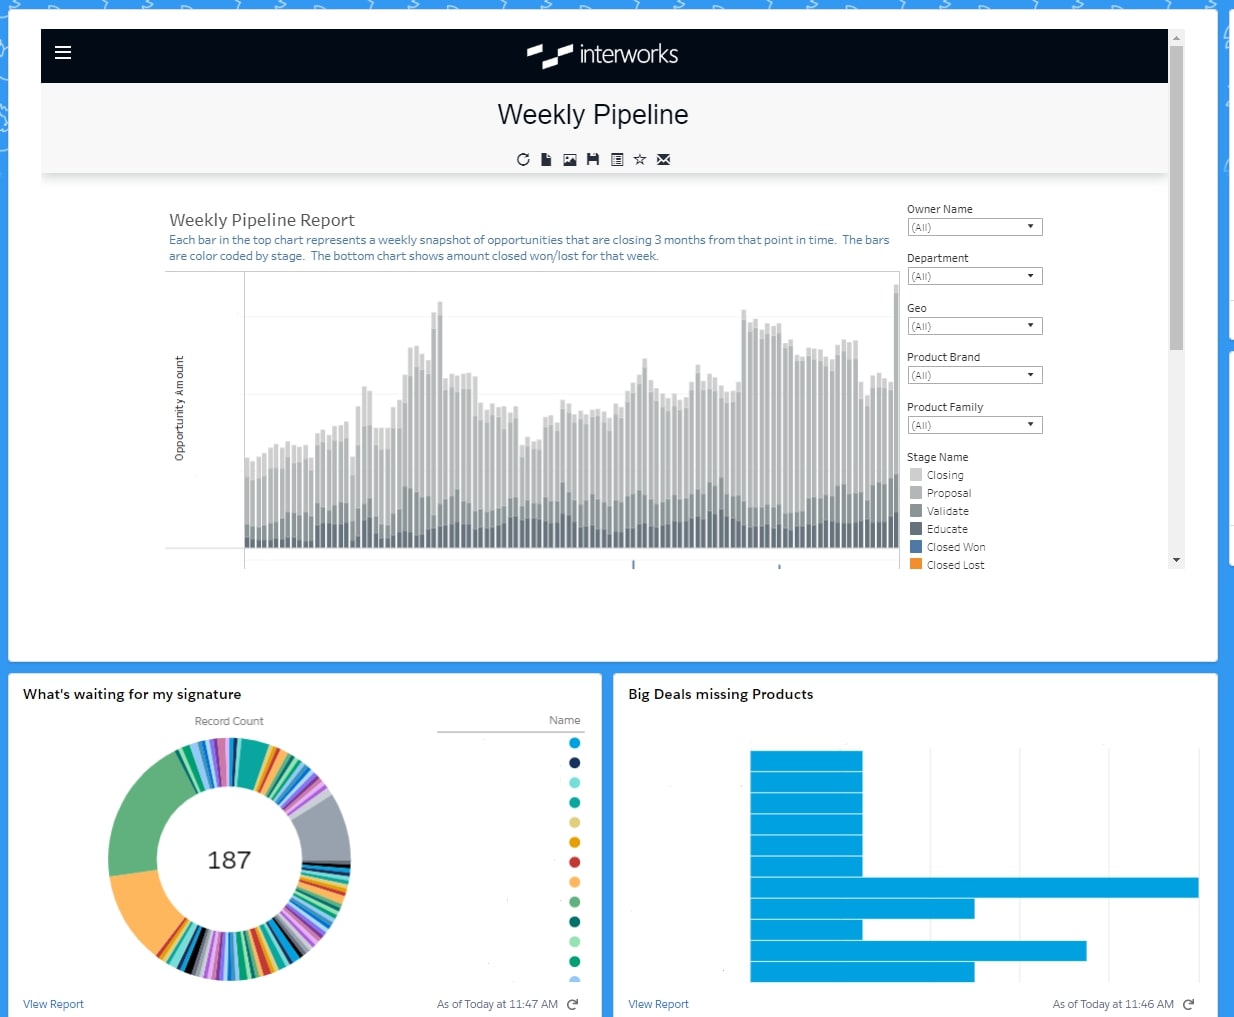
Did you know your home screen is customizable? Yes, you can overwrite what is on your current home screen and add a Tableau dashboard to it. This means you can have to-do lists, Salesforce report charts, Tableau dashboards and lists of records all on the same home page.
You can edit your own home page if you have the privileges by going to the Settings gear in the top-right corner by your name and icon on the home page inside of Salesforce. If you are an admin, you can create a new default, or profile and App specific Home page from the Lightning App builder. Just go to Setup > Lighting App Builder, click New and choose Home Page.
Choose a layout, and use the drag-and-drop feature to bring over a Visualforce component for each Tableau dashboard you want to display. Remember, you can add other things like list views or report charts that are also useful in your organization:

Create a Custom Dashboard and Post It as a Webtab
If you are a manager or a salesperson, you could create a dashboard to help your sales team prioritize their time. This will give your team the tools it needs to answer questions like:
- “Which opportunities haven’t been touched in a while?”
- “Which opportunities are waiting on an action from me?”
- “What projects are in danger of getting off schedule or have missed milestones?”
If there is already a Tableau dashboard your team uses to manage their data, now it’s even easier to access within Salesforce:

Reference a Tableau Report from Within the Page Layout of a Record
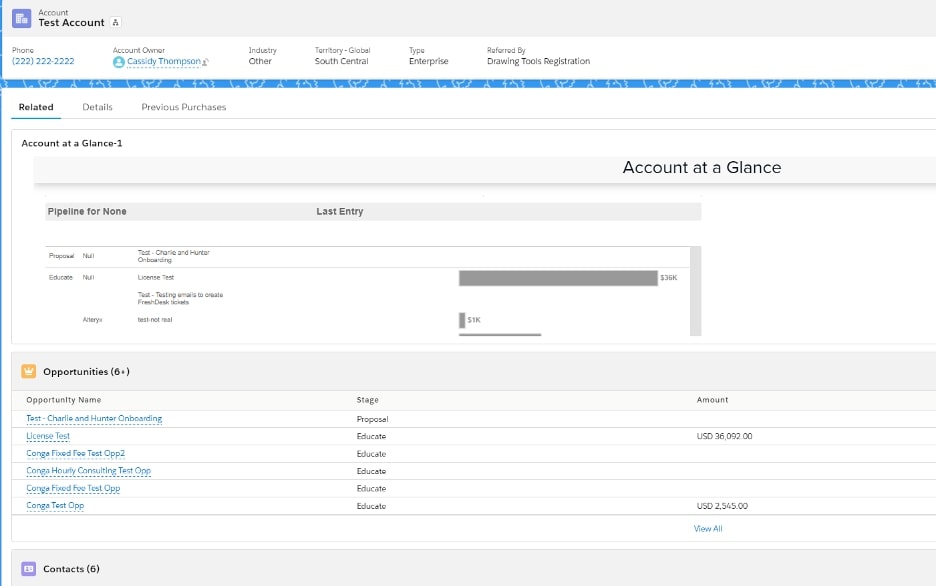
Create a tab on your Account page to show the answer to questions like:
- “How much revenue are we doing with this client?”
- “Are any maintenance or subscription products coming due?”
- “What work have we done with this client before?”
You can add this as a Visualforce component or tab on the Account page. If you want it to filter for the specific Account page you are on, make sure the Tableau report is filtered by Account ID and that you add an object reference to the ID in the markup for your Visualforce page:

Create and Customize How You Want
These are just a few examples of how to use Tableau dashboards inside your Salesforce organization. Really, the only limitation is your own imagination. If you have an idea that you want to talk through about the kind of dashboard you’d like to see or need help getting it embedded in your organization, feel free to contact us.

