
As with all things Tableau, some of the more surprising tricks happen when you’re asked a seemingly simple, yet surprising, question. In this case, it went something like this:
‘Yes, the line chart is good but can we get a ‘fake’ line in there that is always at a 45 degree angle no matter what date I select?’
My first response would be to ask why. Why would there even be a need have something in the visualization that’s not going to be useful to the analytical process? Although it was an odd request, it was, nonetheless, quite intriguing. How would one just plot a straight line from one point to the next, regardless of date/time selected?
Here’s how I approached this:
Step 1:
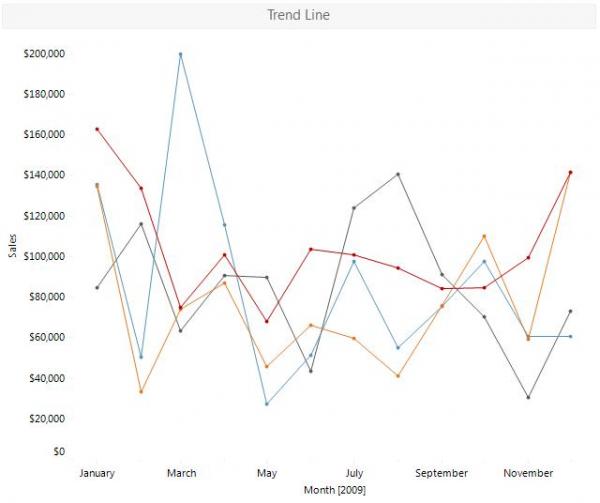
Create your existing, dynamic, chart.
Step 2:
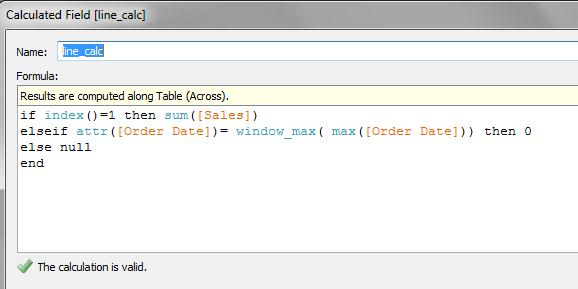
Create the calculated field that will allow us to plot the aforementioned line. Once that is complete, add that field to the ROWS shelf and make it a dual axis.
Step 3:
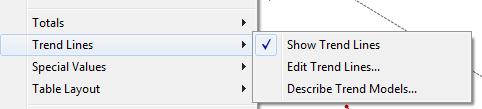
Turn on the Trend Model for that line
Step 4:
Format and remove any unnecessary, non-data, gristle
After creating this, I’m trying to think of some useful and practical applications. One that comes to mind would be some form of a Sprint Burndown chart. That’s all I could think of 🙂
Enjoy!
-Mike