In this series, we will explore different types of calculations involving calculating distance. From a simple iteration to geographic clustering, we will take your data as far as it can go with Tableau.
Adding onto the previous post about increasing our interactivity and boosting the dynamism of our data, we’re now going to discuss how set actions can take you even further in Tableau.
Set Actions Take You the Extra Mile
With the additional functionality of set actions in Tableau 2018.3 and beyond, we can make our map even more interactive by allowing users to simply click a city on the map and have our calculation recalculate instead of selecting from a parameter on the side of view. The calculations are all very similar with the exception that now the city is selected by a dynamic set.
To start off, create a set from the geographic field you are using; here, I am using City, State. It does not matter what selection you make here—this is simply a placeholder for now. Bring this set into the view (I placed it on Detail):
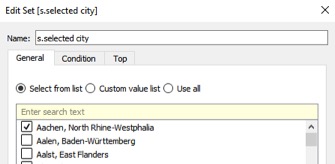
Now, we need to set up a variation of our City, State Indicator field that is used to order the cities in the temporary table. Sets operate as boolean values, either true or false, IN or OUT of the set. The syntax when sets are used in calculated fields can say if SET to mean if SET=true or, in our case, “if a city is in the set.” So our calculation will look like this:

Creating the Set Action
Let’s implement the set action. If you plan to use this sheet in a dashboard, this will be set up as a dashboard action once in the dashboard, but we can also do it as a worksheet action, which is what I have done here. Go to Worksheet > Actions then Add Action > Change Set Values:
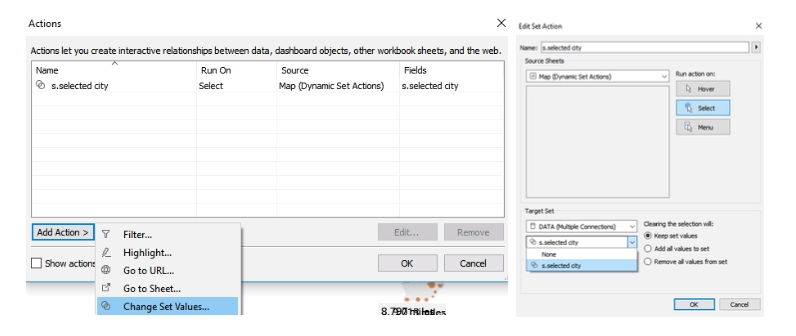
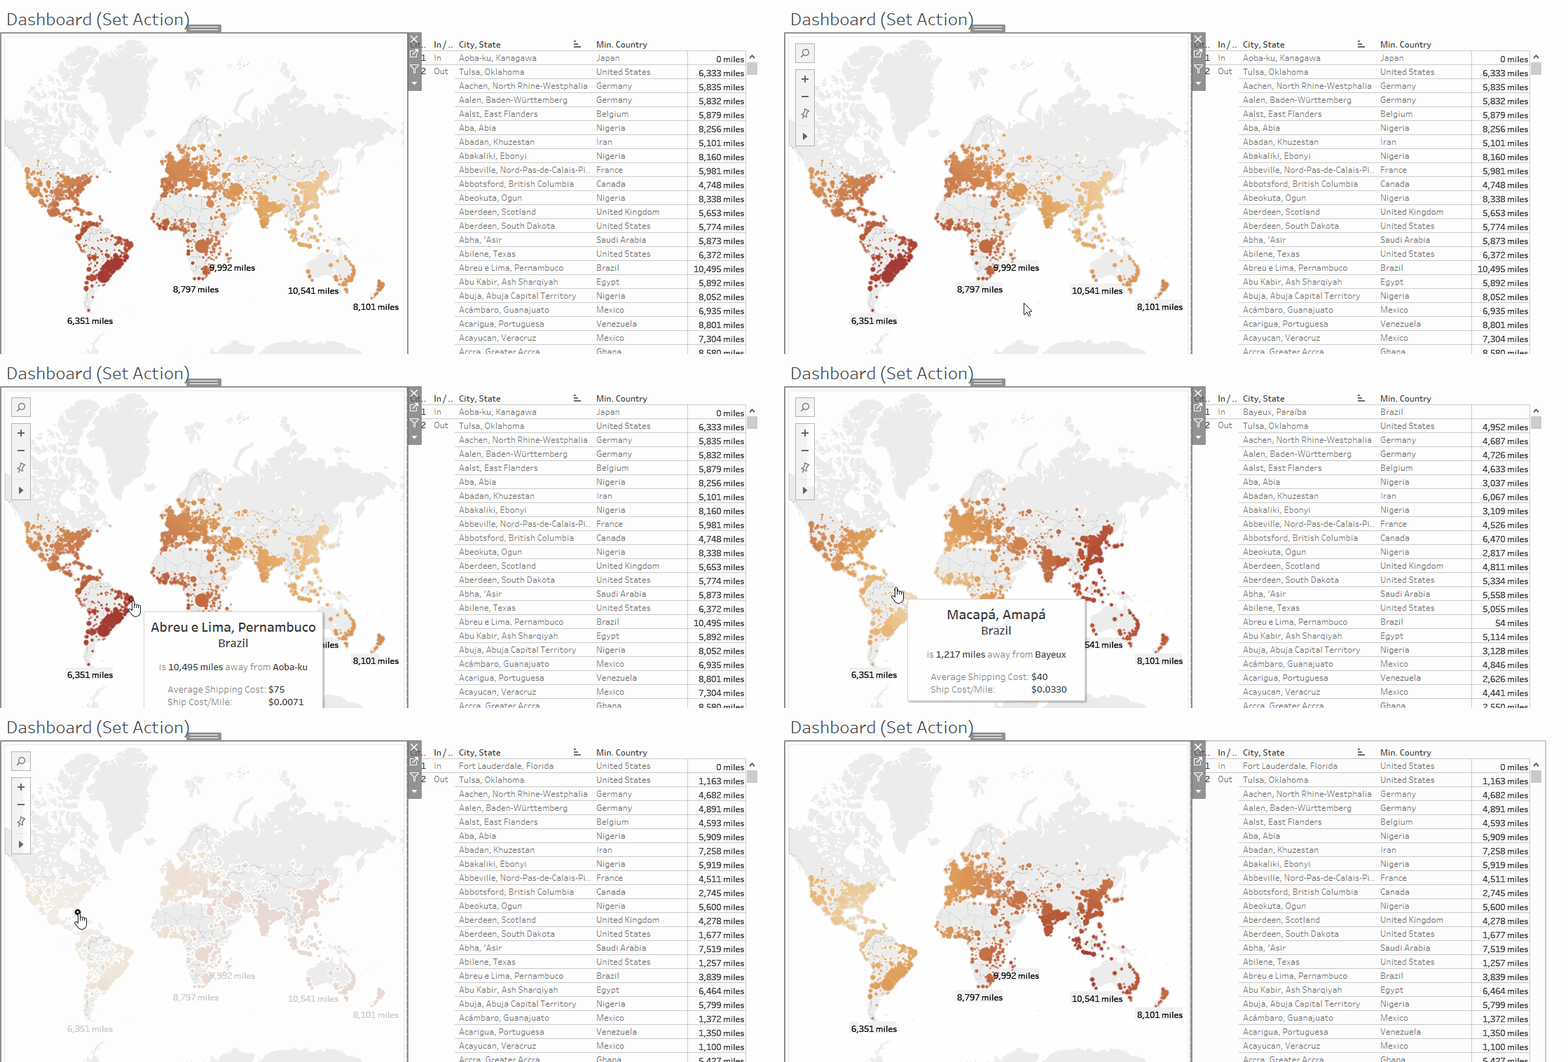
Set actions allow us to dynamically change what values are in the set based off of an interaction with the visualization. In this case, we will run our action on Select, so when our user clicks a point on the map, that point will be in the set. The target set we want to use is the set based off of the geographic field: in this case s.selected city. I am going to Keep set values when the selection is cleared, meaning that if I select Bergen in Norway and then unselect it, it will remain in the set until I select another point:
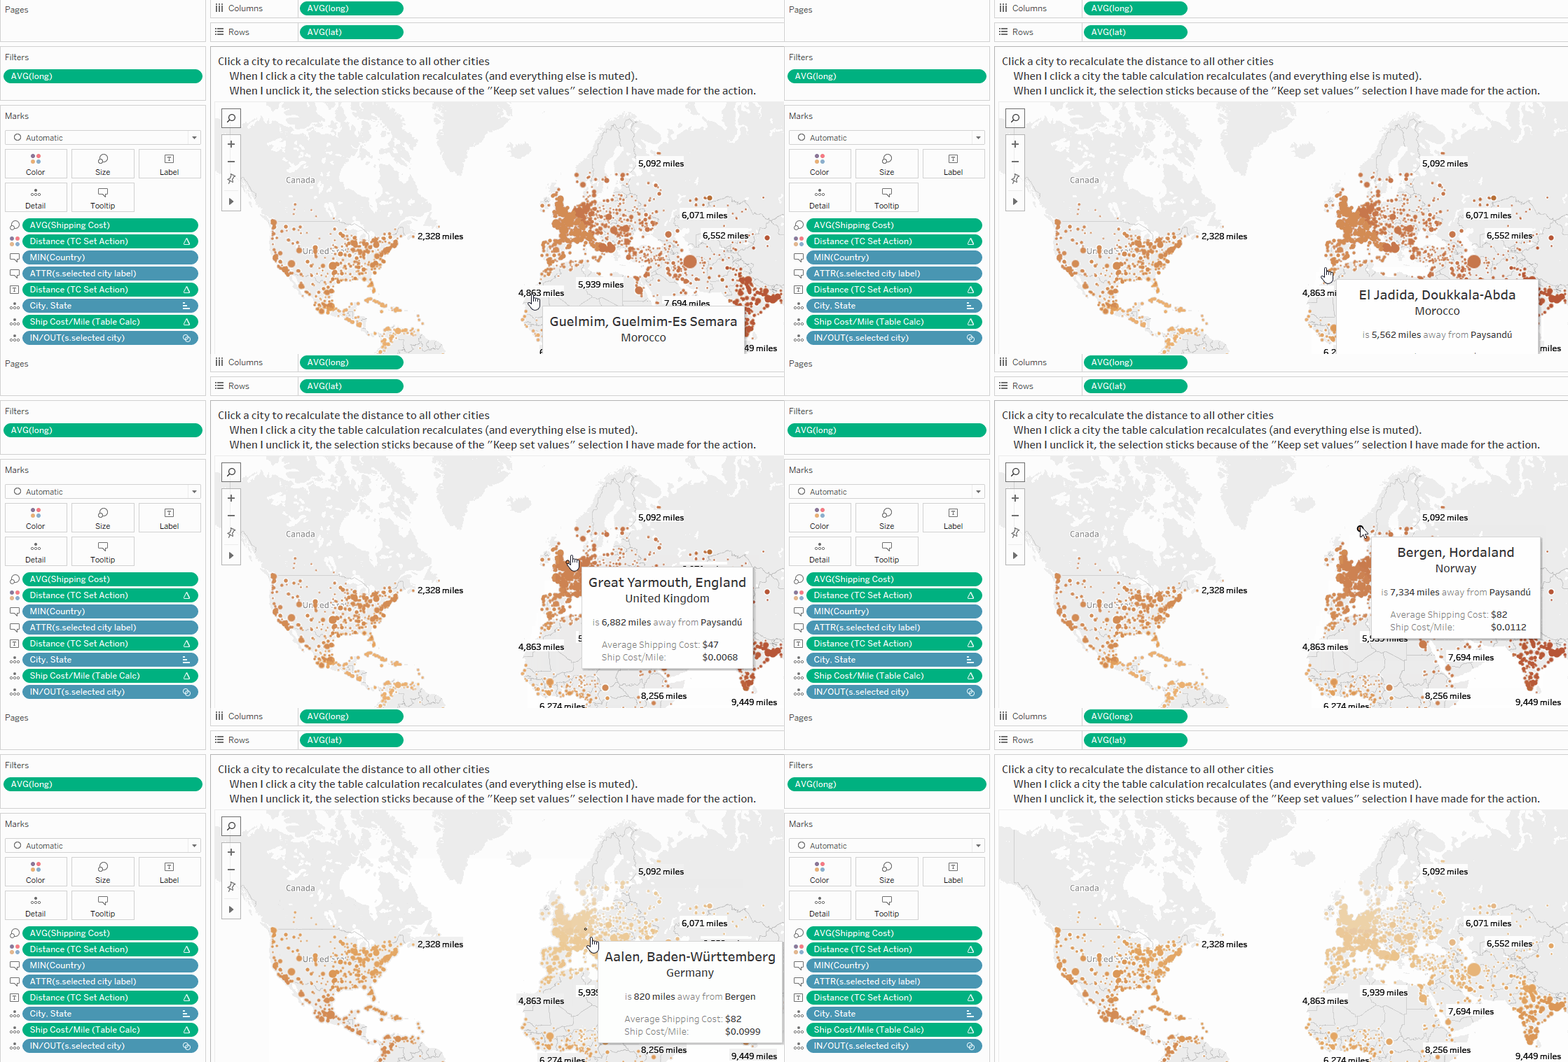
Now we can have a copy of the table calculation we used in the last example (see below) and run it against the selected city:
3959 * ACOS

(

SIN(RADIANS(LOOKUP(AVG([lat]), First()))) * SIN(RADIANS(AVG([lat])))

+COS(RADIANS(LOOKUP(AVG([lat]), First()))) * COS(RADIANS(AVG([lat])))

* COS(RADIANS(AVG([long])) - RADIANS(LOOKUP(AVG([long]), First())))

)
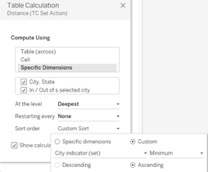
We need to include the set and City, State in the Specific Dimensions and use a Custom Sort on City Indicator (set). This custom sort will cause our selected city—which was assigned the value 1—to rise into the top row of the temporary table, while all other cities—assigned the value 2—will fall below the first row.
Here is how the table calculation works with the set action, both on the map and behind the scenes in the temporary table:
Keep following this series, and catch the next post about making dynamic comparisons and analyzing distribution centers!

