As part of the NHS Transformation Directorate, the Accelerate Access Collaborative brings together industry, government, regulators, patients and the NHS to remove barriers and accelerate the introduction of ground-breaking new treatments and diagnostics which can transform care.
Technologies Used
- Tableau Desktop
- Tableau Server
Services Used
The NHS Accelerated Access Collaborative (AAC) is an umbrella organization for healthcare innovation in the UK, established in 2018. It is a unique partnership of patient groups, government, industry and NHS bodies working together to streamline the introduction of new innovations into the healthcare system. The AAC supports all types of innovation: medicines, diagnostics, devices, digital products, pathway changes and new workforce models.
Key Data Challenges
NHS AAC faced several key challenges. Differing priorities across various groups made it difficult to maintain consistent progress on their analytics journey. High staff turnover disrupted continuity and diluted the impact of existing initiatives. In addition, the various reporting tools used to track performance and progress lacked standardization, making it difficult to analyse and apply data. Together, these issues hindered the organization’s ability to adopt a truly data-driven culture. To address these challenges, NHS AAC approached InterWorks to support the entire analysis process from user requirements gathering to prototyping and report development.
InterWorks’ Approach and Solutions
InterWorks began with a thorough user requirements gathering process, engaging with all relevant stakeholders through five focus groups to capture a comprehensive set of needs and objectives. This foundational step was critical in aligning the direction of the project with the expectations of the NHS AAC.
Next, the teams moved into the prototyping phase, creating iterative models of the proposed solutions. This phase was characterized by regular feedback loops, ensuring that each iteration was refined and improved based on stakeholder input.
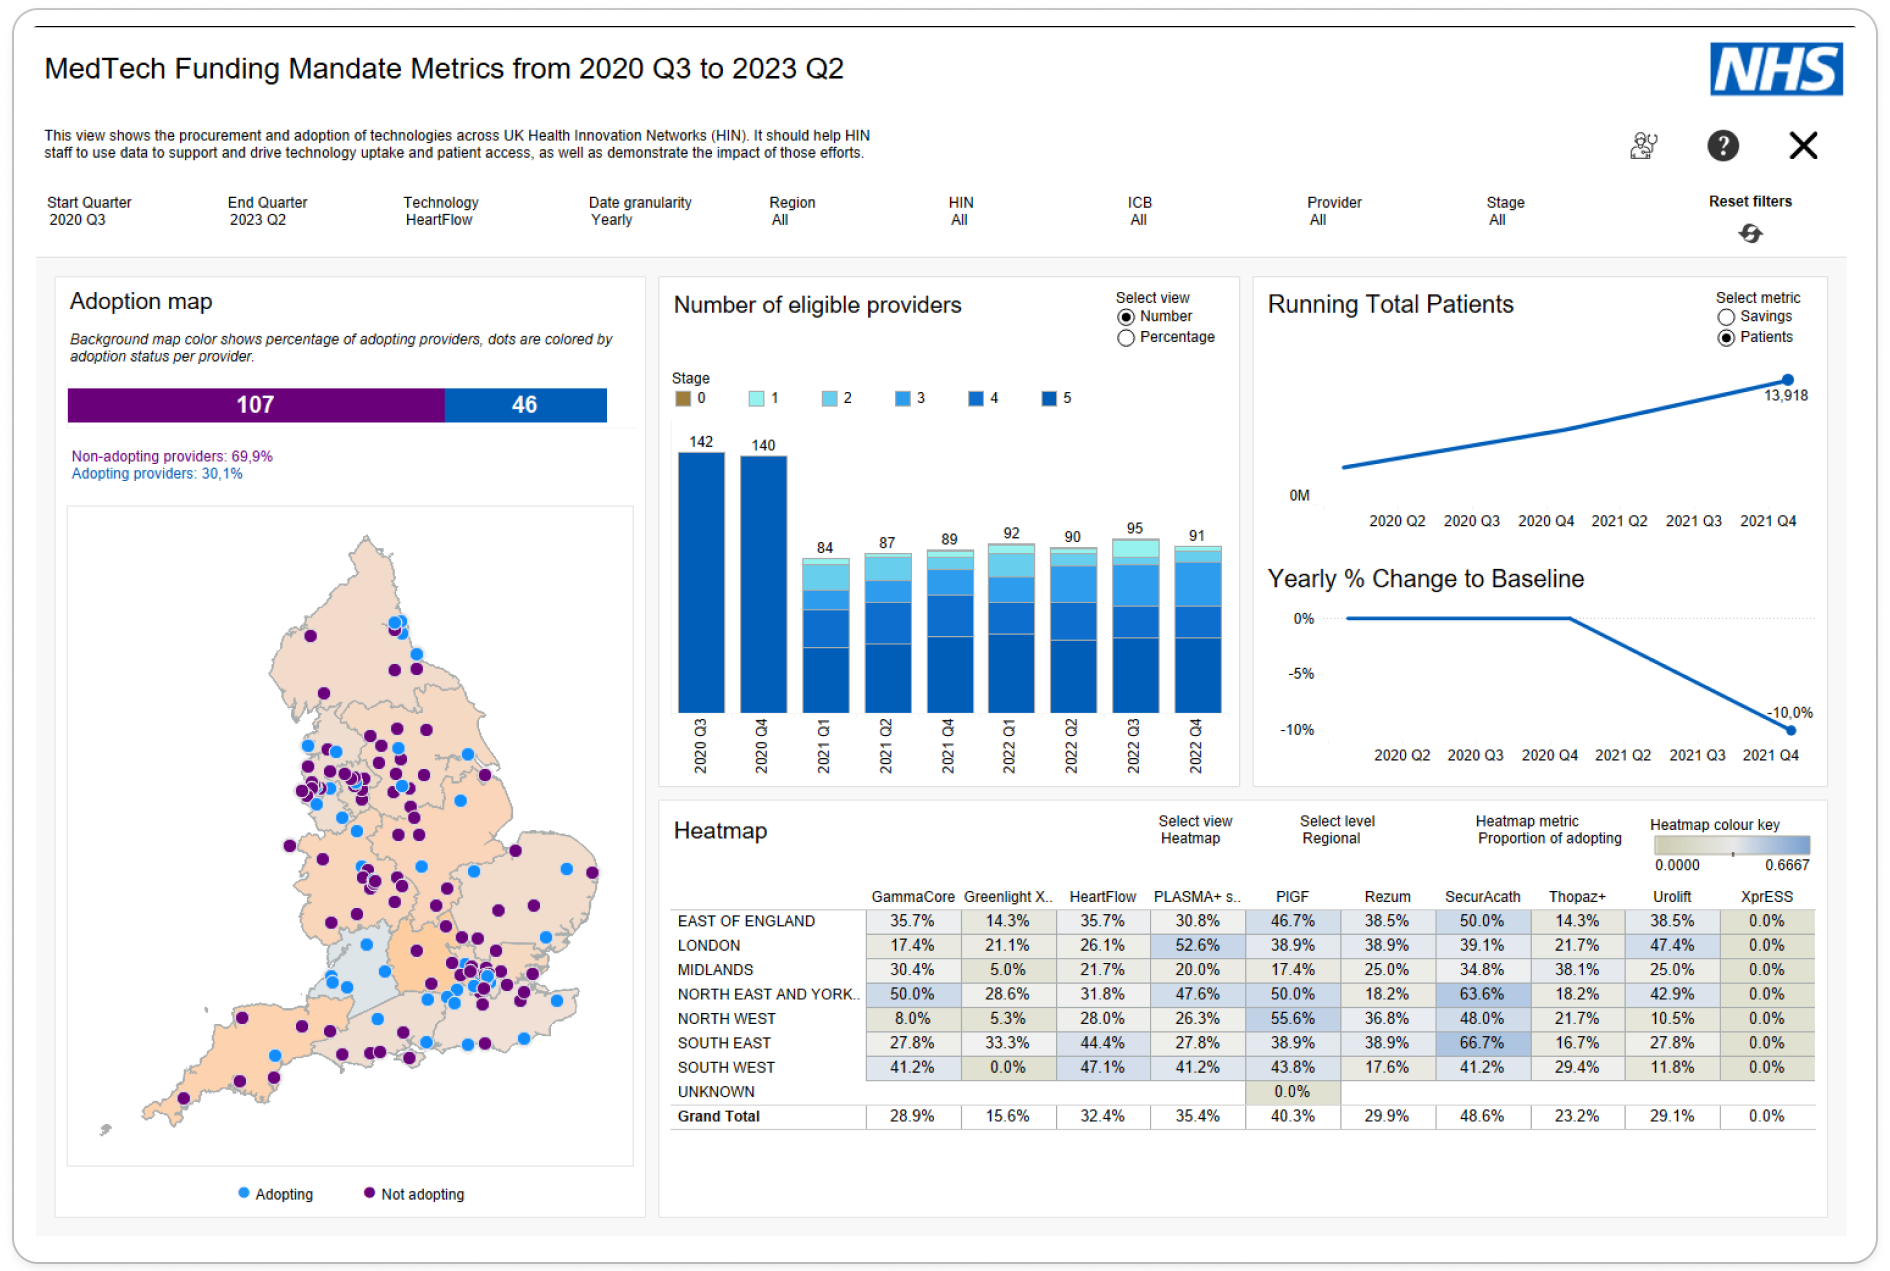
The final phase involved the development and deployment of detailed reports tailored to the specific needs of NHS AAC. Using Tableau, InterWorks developed robust dashboards to track performance and progress. These tools were designed to be intuitive and accessible, allowing users to easily derive actionable insights.
Apart from developing dashboard solutions for each of the five teams, InterWorks followed its own Design Thinking for Data methodology, outlined in the Solution Design Sprint. Inspired by Google Ventures’ Design Sprints, this approach applies human-centered design principles to clarify business intelligence problems. It particularly focuses on the initial problem statement and key metrics, and rapidly prototype these solutions for immediate feedback. The Solution Design Sprint consists of four phases: Clarify, Ideate, Prototype, and Evaluate.
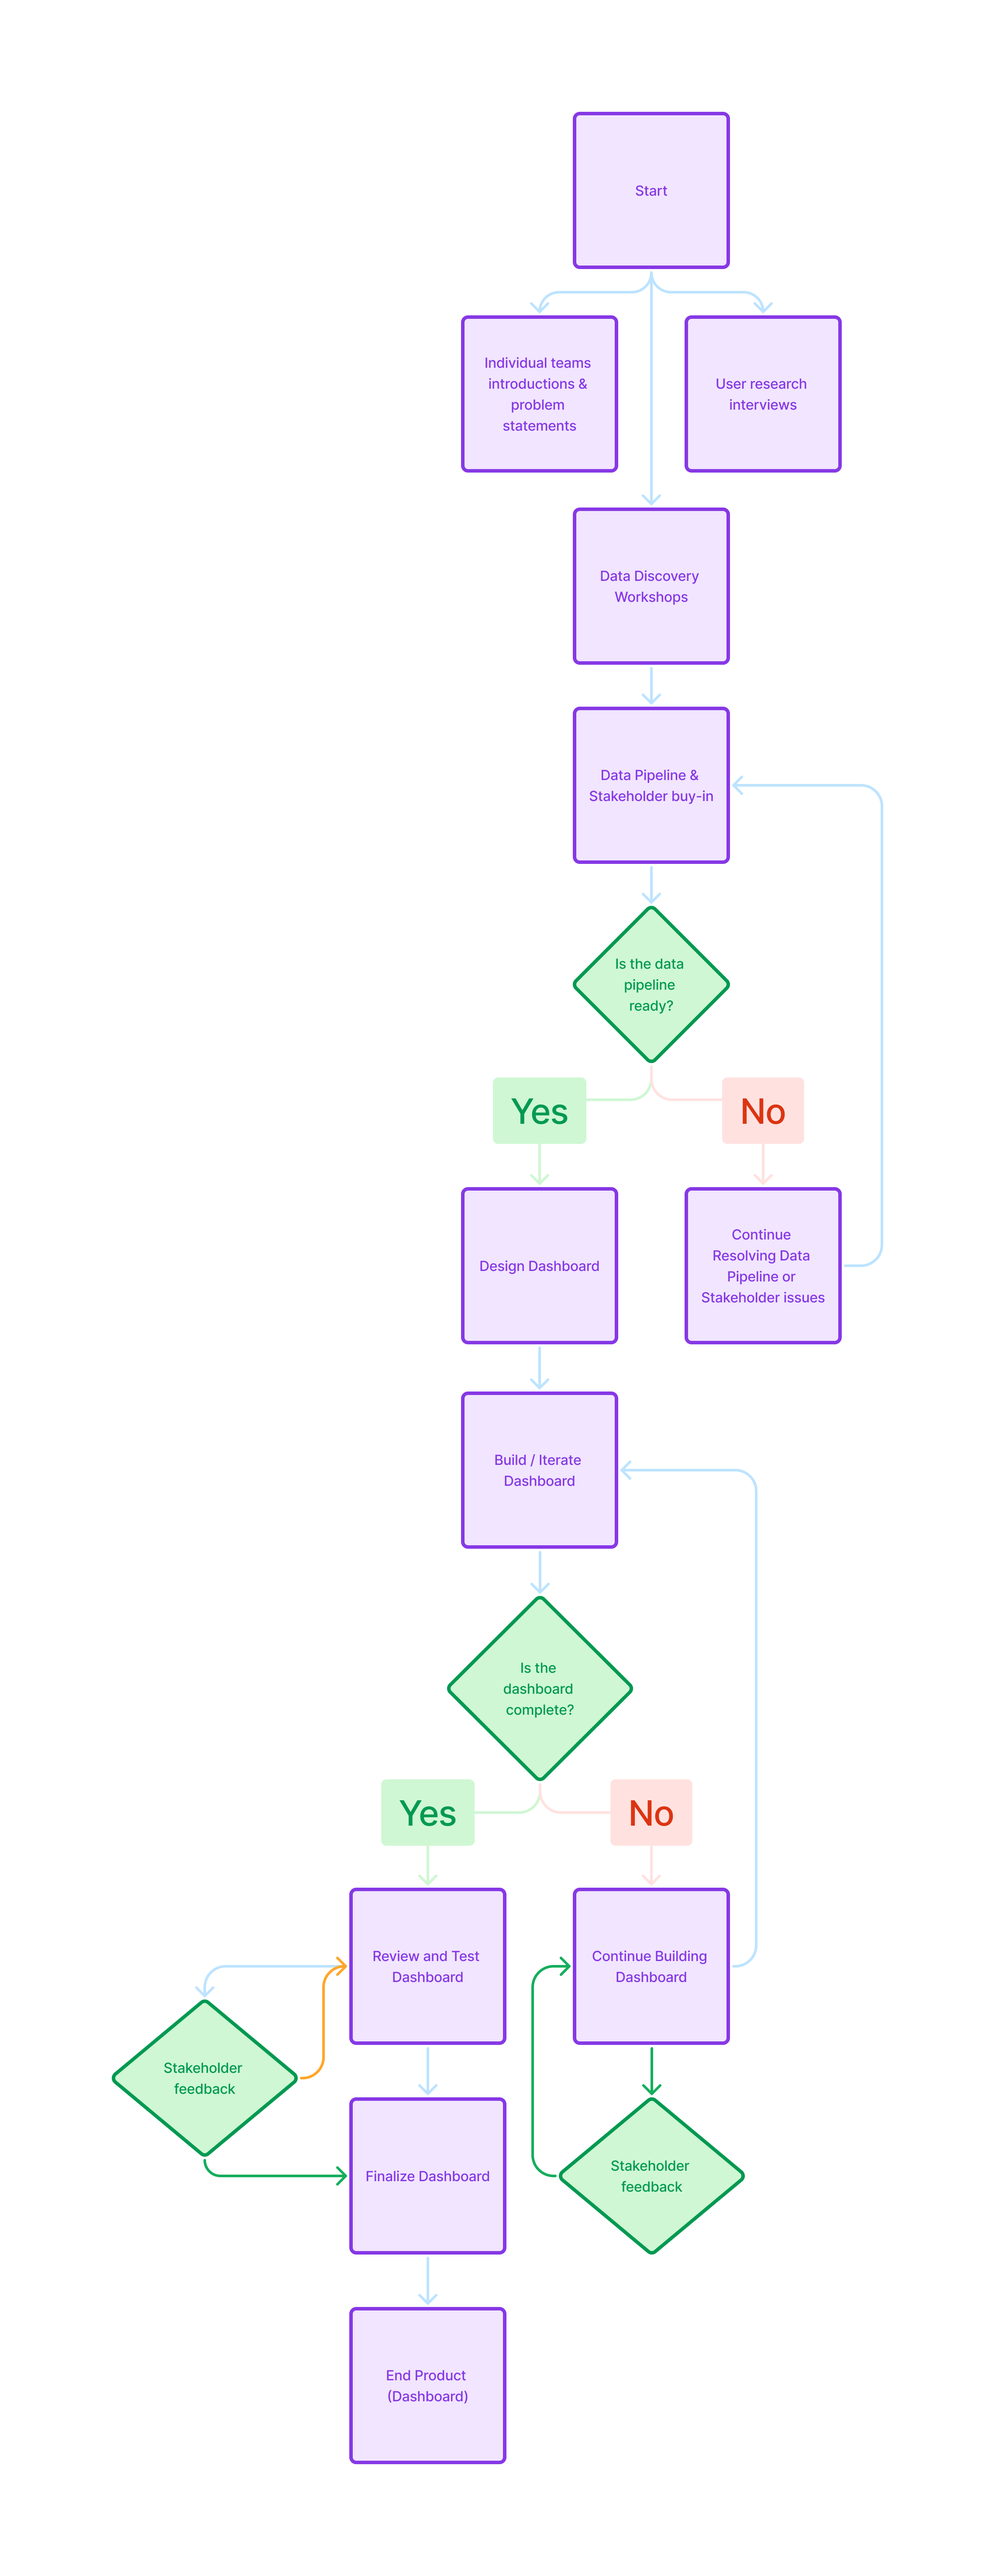
Above: The Solution Design Sprint.
In the Clarify phase, InterWorks focused on clarifying the problem statement, agreeing on the team’s mission and goals, identifying pain points and uncovering the “why” behind those pain points. This was followed by the Ideate phase, which generated a wide range of ideas through effective and creative brainstorming sessions. During the Prototyping stage, virtual workshops were held to create mockups of the data solutions. Finally, in the Assess phase, InterWorks conducted iterations to implement the necessary changes and move the teams from outdated analytics methods to improved and efficient solutions.
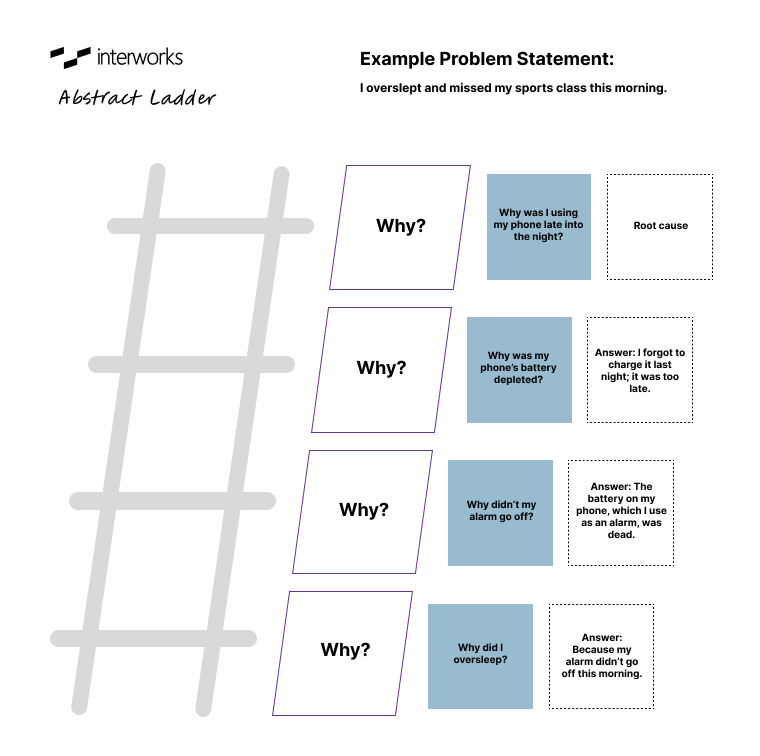
Above: The Abstract Ladder exercise.
An effective exercise from these workshops was the Abstract Ladder exercise. This technique helps uncover the root cause of a problem by repeatedly asking, “Why?” Starting with an initial problem statement, each subsequent “why” question digs deeper, revealing another layer of the problem. For example, if the problem is something simple as, “I overslept and missed my gym class this morning,” the first “why” question might reveal, “Because I went to bed late. Another “why” question might reveal, “Because I was on my cell phone late into the night.” This process continues until the root cause is identified. In this case, it was a lack of evening routine. By identifying the root cause, more effective solutions can be developed to prevent the problem from recurring. We used the same exercise to identify organizational goals and missions for each of the NHS AAC teams.
Measurable Outcomes and Benefits
The results of this collaboration were significant. NHS AAC experienced notable improvements in their ability to track performance and progress across various sub-departments. Key stakeholders reported high levels of satisfaction with the new reporting tools, highlighting the clarity and usefulness of the data provided. These positive results demonstrated the value of InterWorks’ customized approach using design thinking methods and set a precedent for future projects.
The InterWorks team did a fantastic job facilitating several workshops for our Programme, using interactive tools and expert facilitation to draw out information about our data inputs. The team helped us understand each data input in more detail, prioritise and categorise these based on usage, and drafted charts for us to consider how we want to visualise our data. The InterWorks team were a pleasure to work with, adapting their engagement approach and content based on our Programme’s needs and effectively supporting our team to use tools they were previously unfamiliar with, to make best use of the time.
– Tania Tailor, Senior Manager – Consultancy, Data for R&D
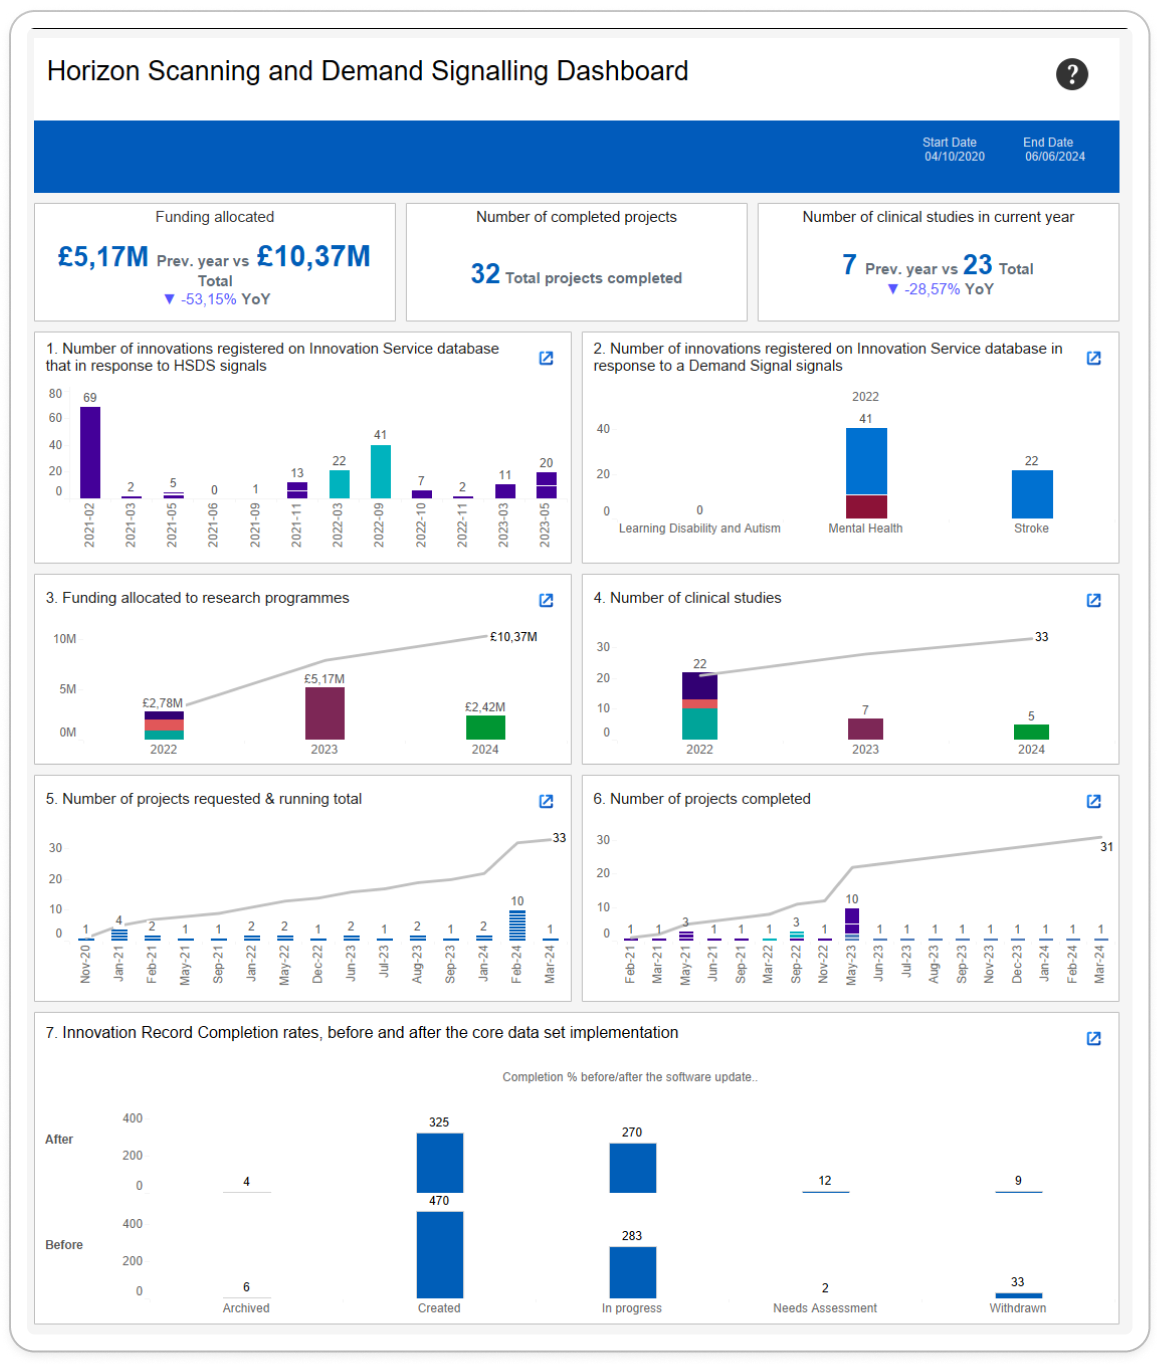
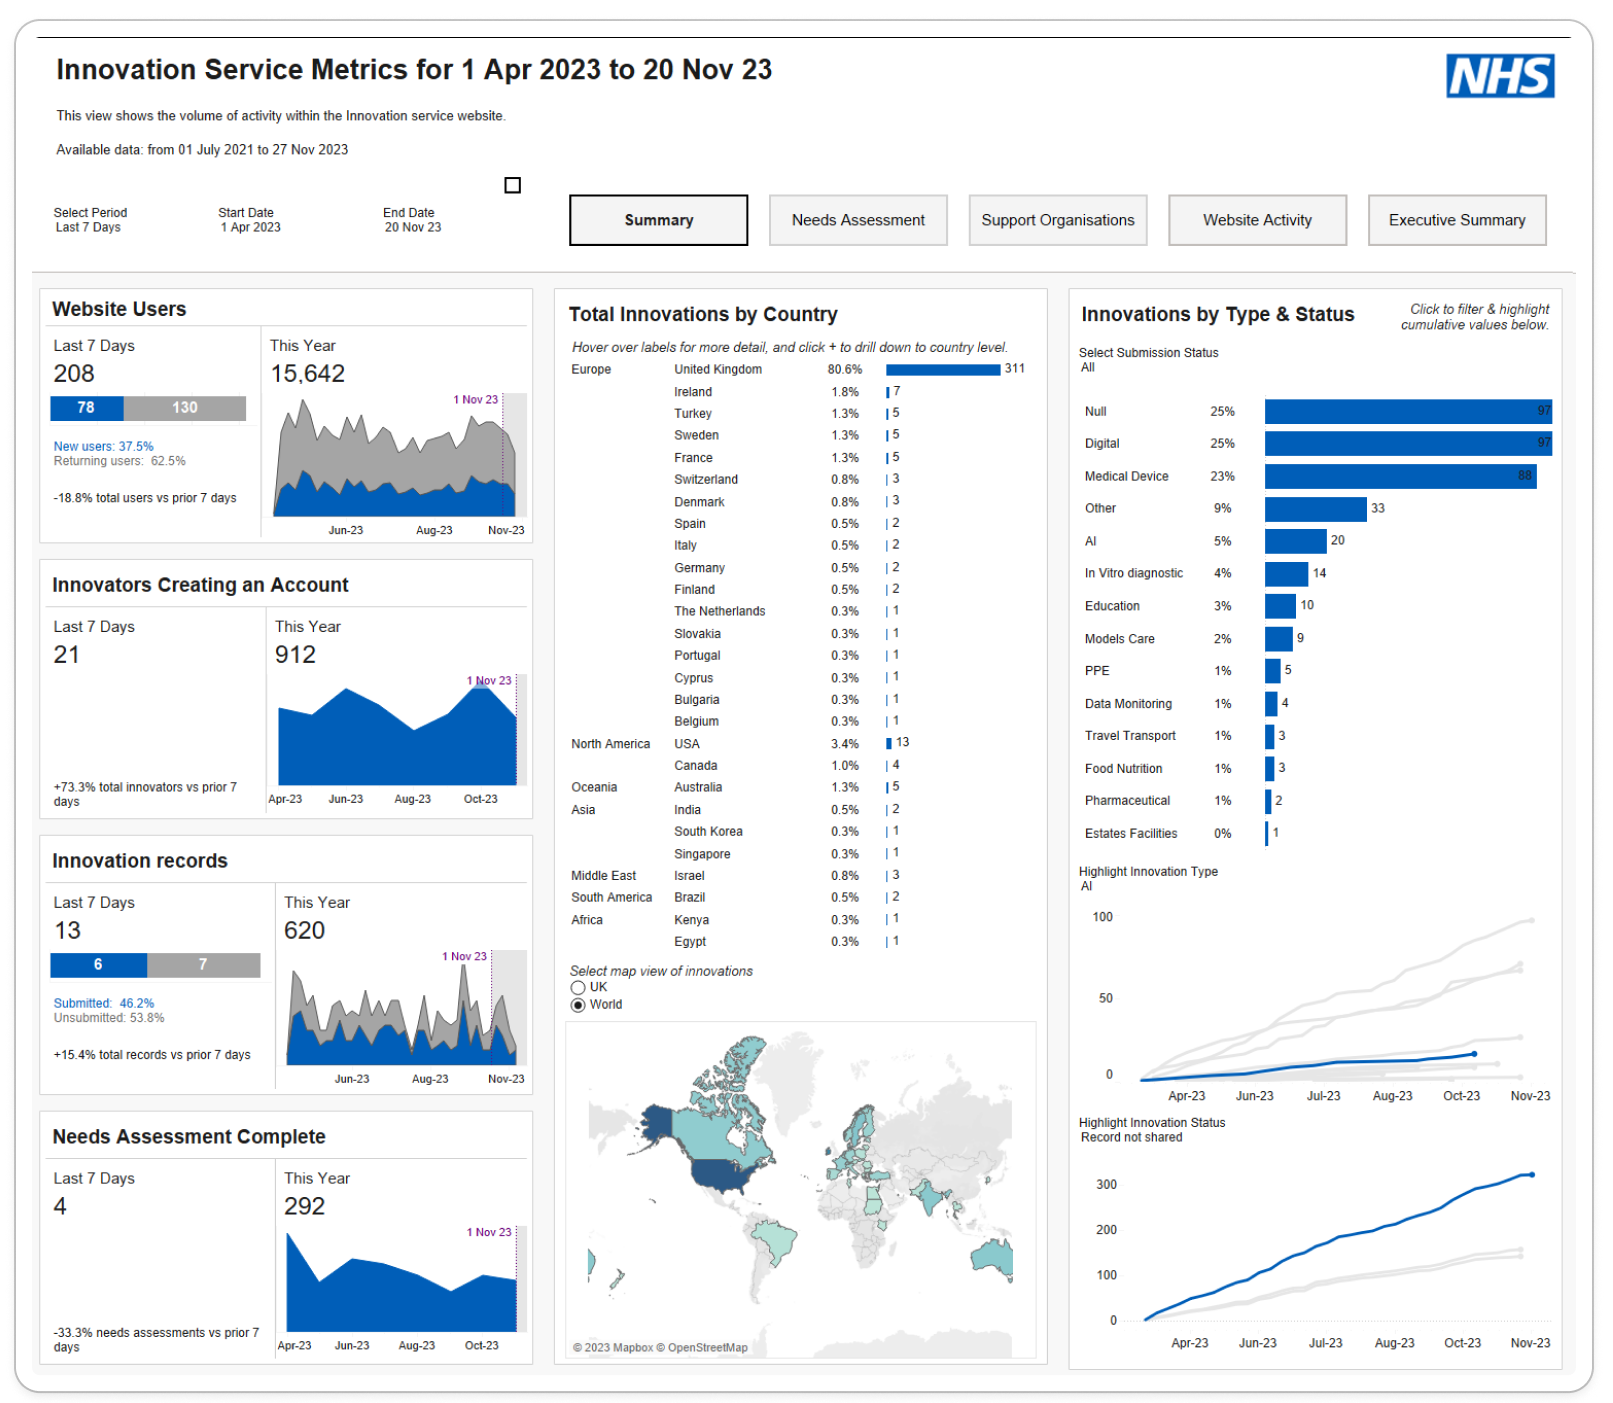
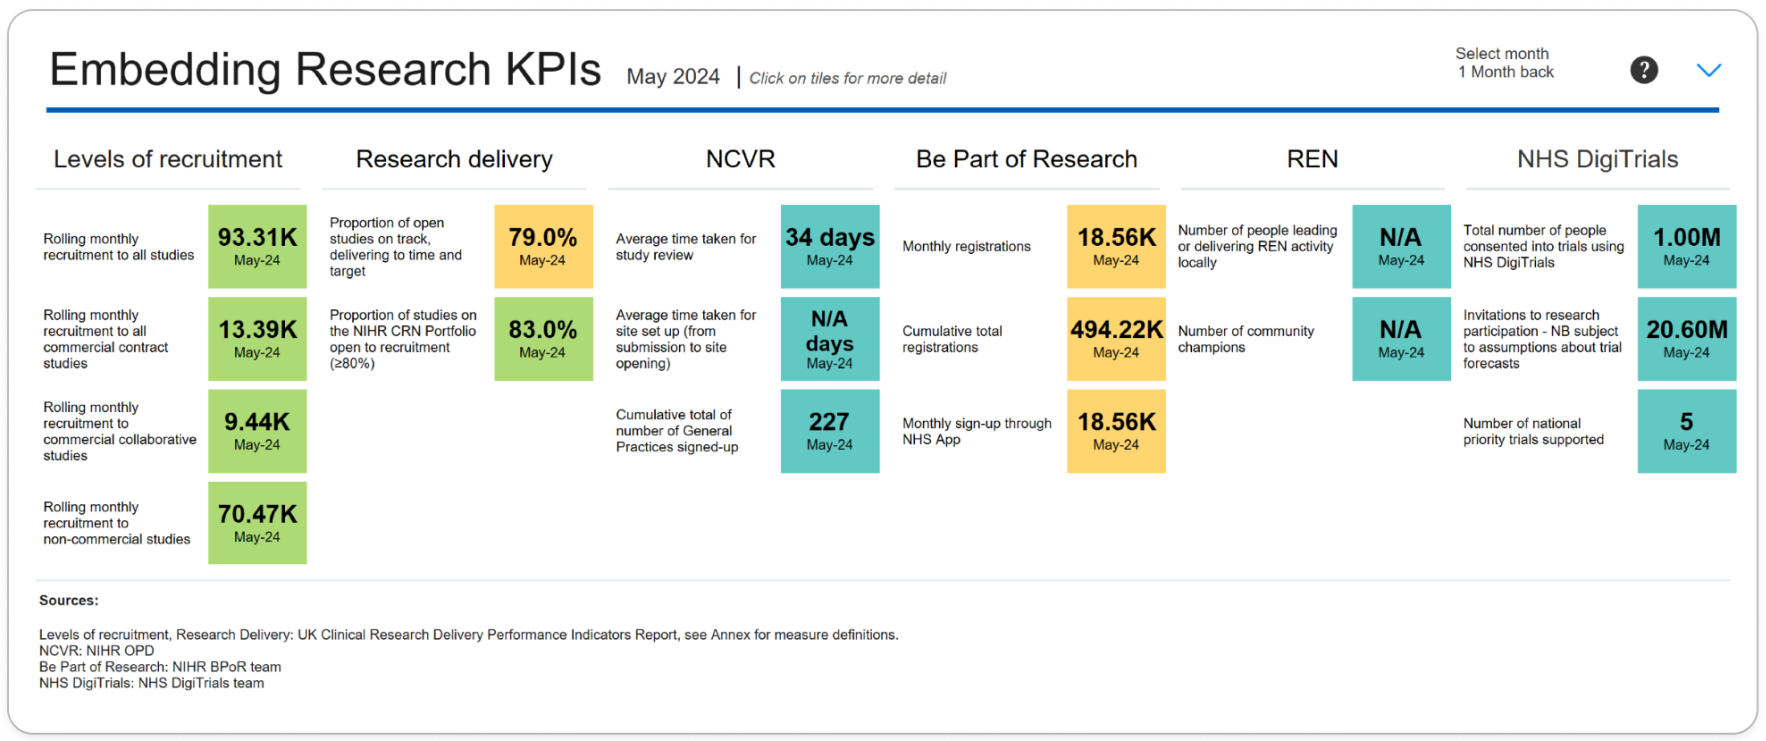
Several important lessons were learned from this project. First, the importance of gathering comprehensive user requirements. This step ensures that the final solutions are both relevant and effective. Second, the iterative prototyping phase proved invaluable, allowing for flexibility and responsiveness to stakeholder feedback and changing reporting requirements. Finally, the use of advanced analytics tools such as Tableau greatly enhanced NHS AAC’s ability to track and analyze performance across different sub-programs. Explore some of the top dashboards created for end users below.
