
With Tableau 8.2 now available, the InterWorks team wants to give you an in-depth look at some of our favorite new features. Our What’s New in Tableau 8.2 blog series covers these in detail. This post is the fourth post in the series. Check out the full list on our Tableau 8.2 blog channel.
The new feature in Tableau 8.2 that I’m most excited about is the new storytelling feature, Story Points. Tableau has always been a great platform for taking data and turning it into something you can learn from through data visualization. The new interface should make highlighting the key points that you want to share with others a breeze. Hopefully, you’ll never have to copy and paste an image of a dashboard into a PowerPoint slide deck again.
Getting Started with Story Points
I used the Sample – Superstore data set in making this story for those of you following along. I also included the final story at the end of the post, so you can view through it and download it for yourself.
Unlike with sheets and dashboards, there is no one-click solution for starting up a story. Notice in the image below that there isn’t a convenient story button to go with those.
![]()
There are two ways to start up a story. The first is to right-click in the bottom strip and select New Story.
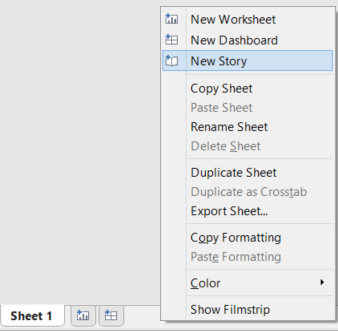
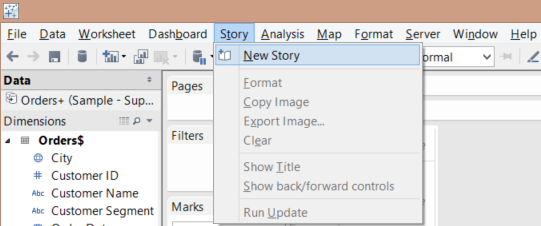
You could also go to the top menu bar and select New Story from the Story drop-down menu.
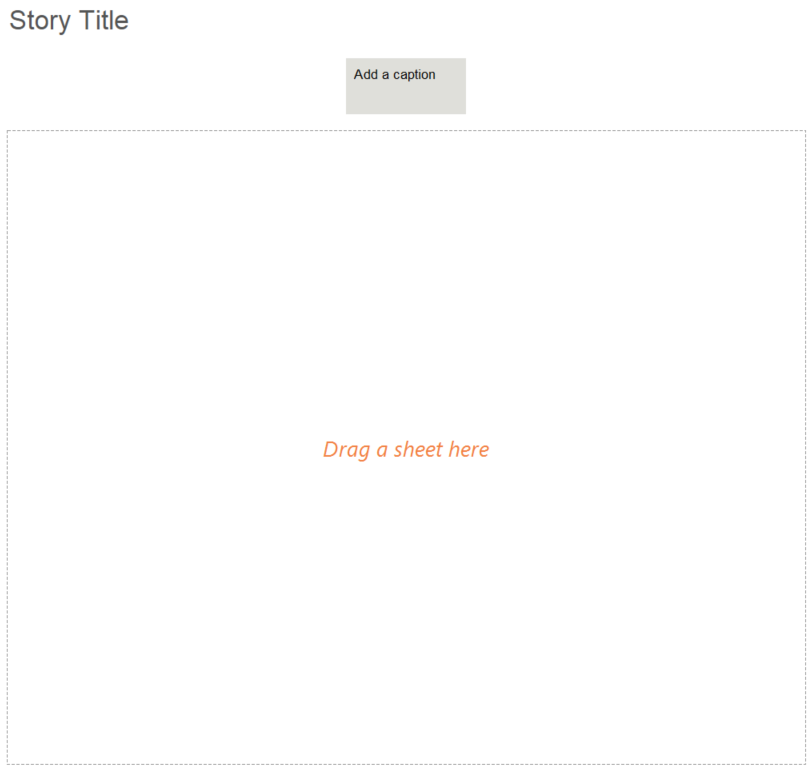
One of the first things you’ll see is somewhat of a misnomer. You can drag either a sheet or dashboard into a story – both will work just fine. I’ll begin our story by adding individual sheets.
You’ll probably notice that the first time you add a sheet, you won’t have much control over how it’s displayed in the story. That legend is not moving from the top-right corner, no matter how many times you click on it. You’ll also need to adjust things like the width of your sheet in the sheet itself.
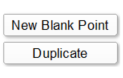
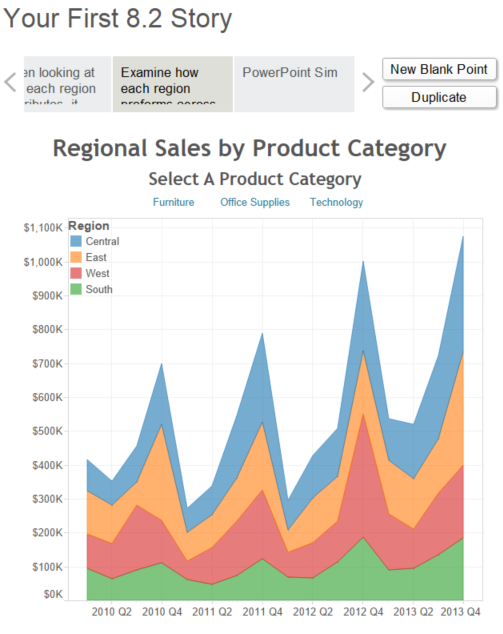
To get to a new “chapter” (my term, not necessarily Tableau’s), click on New Blank Point to start from scratch. You can also click on Duplicate if you’re using the same sheet/dashboard from the last slide and want to save a step.
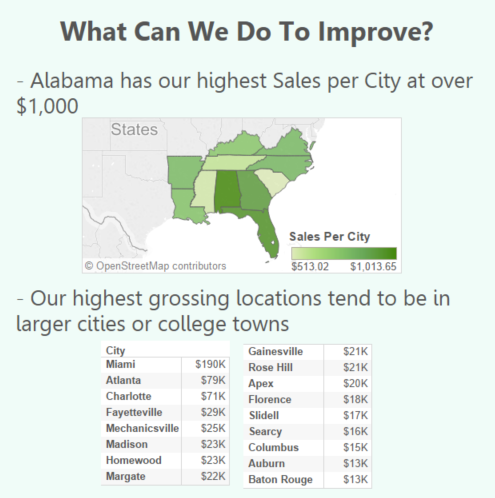
Something that the Story Points feature does very well is highlighting specific parts of your data. Once I add in my new sheet, all I need to do is click the region that I want to highlight and click Update above the caption for this story point. Consequently, when someone first sees this “chapter,” the selected region will already be highlighted.
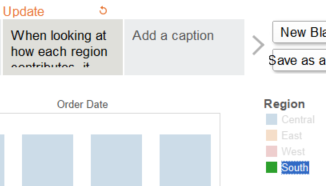
If you want to call it out further, add a description. This action can be done by clicking and dragging Description from the left-hand sidebar and dropping it where you’d like on the story.
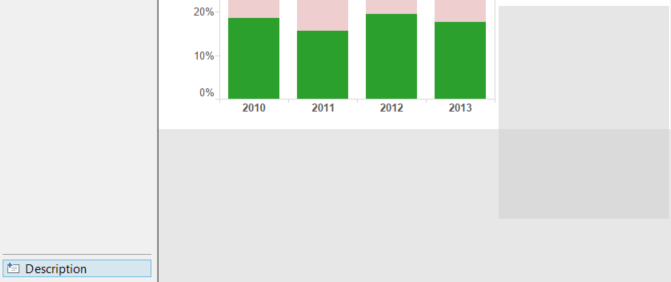
Once you do this, you can then enter your text and do some fine-tuning after it’s in the story. The easiest way to do this is by right-clicking on your description and selecting Format Text.
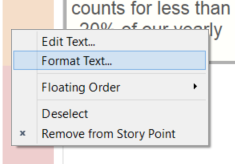
From there, you can adjust the shading, alignment and border of your description on the left-hand side.
If you’re anything like me, and you have a pretty specific idea of how you want your presentations to look, you’ll probably end up sticking to dashboards when it comes to what you place in your stories. Besides the obvious things like the ability to include multiple sheets, the use of dashboards allows you to decide where to put your cards. When dealing with a size constraint (like I am with this blog post), you won’t want to give a huge chunk of real estate to a color legend and white space. Adding a dashboard is functionally the same as adding a worksheet. Simply build the dashboard as you normally would and drag it in from the left-hand side.
Old Habits Die Hard
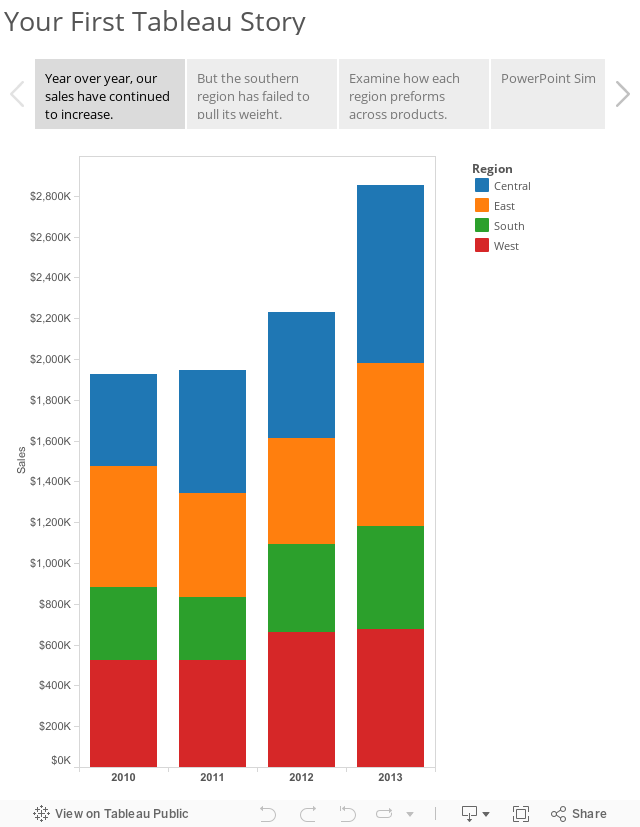
The reality is that you’ll sometimes have a need for a more typical PowerPoint slide. The Story Points feature in Tableau 8.2 does a great job of making that very easy to replicate. By using text boxes on a dashboard, you can have Tableau become your presenting program and keep your data interactive. This method beats the alternative of having to copy and paste image files into a slide deck.
Here’s the interactive version:
Story Points Will Be Big
I think the Story Points feature will end up being a huge part of Tableau moving forward, with my last point being the main reason. Instead of pulling out another bland and static PowerPoint slide deck at your next meeting, you can just as easily create an interactive presentation that will engross your audience and encourage further discovery. A great presentation of data always finds a story to tell. Story Points will make telling that story much easier.
Learn More
Want to learn how to utilize the new Tableau 8.2 features in your business? InterWorks is the leading provider of Tableau consulting and training services. Let us know how we can help!