Three Seasons of Man vs. Food Visualized in Tableau 8.1

Data

Three Seasons of Man vs. Food Visualized in Tableau 8.1

//

I recently upgraded my version of Tableau Desktop to 8.1.  While on holiday, I decided to play with the program a bit to mess with some of the new features.  In lieu of any ground-breaking analysis, I decided to have fun.

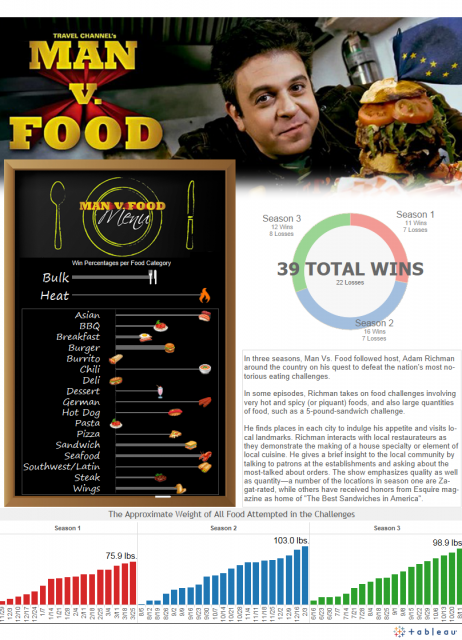
I submit for you a dashboard of three years of the reality television show, “Man vs. Food”.  (click the image to interact)

Man vs. Food in Tableau 8.1

More About the Author

Tom McCullough

Solutions Architect
New Default Setting in Tableau Server 9.1 Will Break Embedded Dashboards If you embed your Tableau analytics dashboards through either a straight embedded i-frame or with the JavaScript API, upgrading your ...
Using import.io, Python and Tableau LOD Calculations to Visualize Top Baby Names over 101 Years I haven’t had a ton of time to really dig into the new features of Tableau 9, but I did want to start playing with the new Level ...

See more from this author →

InterWorks uses cookies to allow us to better understand how the site is used. By continuing to use this site, you consent to this policy. Review Policy OK

×

Interworks GmbH
Ratinger Straße 9
40213 Düsseldorf
Germany
Geschäftsführer: Mel Stephenson

Kontaktaufnahme: markus@interworks.eu
Telefon: +49 (0)211 5408 5301

Amtsgericht Düsseldorf HRB 79752
UstldNr: DE 313 353 072

×

Love our blog? You should see our emails. Sign up for our newsletter!