It’s a new year, so like clockwork, there’s a new release of Tableau Desktop currently in beta: version 2020.1. There are a couple of features that immediately grabbed my attention, so here’s a quick example of dynamic parameters and animations.
Dynamic Parameters
With dynamic parameters, you can now:
- Refresh a parameter’s list of values based on a column in your data source (YES!)
- Set the current value of a parameter to a calculated field
I’ve used the sample data provided on Snowflake’s cloud data warehouse, which is built from OpenWeatherMap data. It’s provided in JSON format, which is no issue as Snowflake makes it really simple to query semi-structured data. As Snowflake allows data sharing across accounts, I can create a database in our Snowflake instance and write a view that drags over the fields I need from that sample data. With a live connection, I now have a daily-updated dataset ready to demo the new dynamic parameter features in 2020.1. However, as this dashboard is published to Tableau Public, you’ll have to take my word for what happens with a live connection.
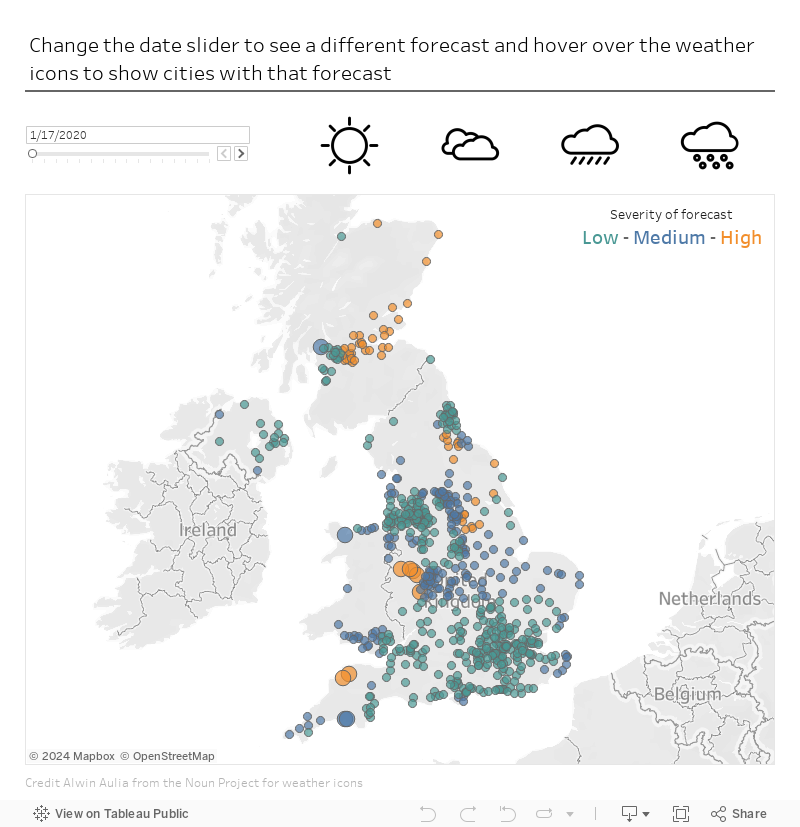
Firstly, I’d like my end user to choose the date of the weather forecast they’d like to see, BUT I’d like this to default to the earliest date in my forecast column rather than the latest. I can’t do that with a date filter, so I’m going to use a parameter for this purpose.
This is what the Edit Parameter window looks like now:
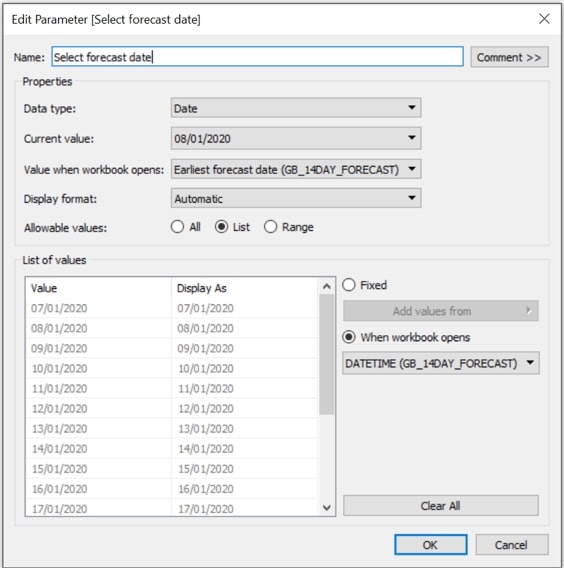
Those key extra options for list parameters are found in the drop-down menu of Value when workbook opens. You can set the list of values to the field When workbook opens, so that list will be fresh and updated based on our data.
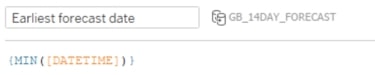
I’ve set the list of dates to be populated by those available in my forecast data, and I’ve set the parameter to be the earliest forecast date by creating a separate calculated field to fix the forecast date to the MIN( ) value:
Viz Animations
I mentioned animations earlier, and to see what Tableau has introduced, just change the date parameter in the dashboard. You’ll notice how the transition of the data points is now graduated rather than abrupt.
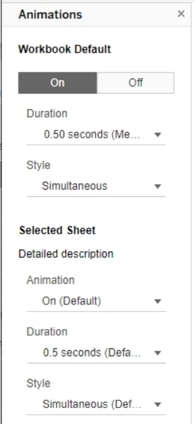
You can control these animations via the Format menu > Animations where you can turn them on or off, set the duration and specify whether all worksheets change simultaneously or sequentially. These settings can be different per worksheet if required:
Here’s a GIF of the animations at work:
The workbook itself is available on Tableau Public. You can see it below: