“I’ve filtered my countries to show me my top 10 by sales. However, I still want to see the information for England in the table and maybe Italy as well. Is there any way I can force these two to show up, as well as the top 10? What if I want to let the user choose which countries they want to add?”
Why, yes, there is a way!
Your first thought might be to use a parameter. While parameters would let us choose a specific value to compare, we would unfortunately be limited to only one since multi-select parameters are, at this point, not a thing. The newly introduced set actions can act as a substitute in this specific case, though!
Let’s draw out what we want to do before we get started:

We want to be able to see our top 10 countries, as well as any countries we specify. These may overlap (ex: I really want to see the United States, so I specify that, but it’s also in the Top 10), or they may be distinct, but we want to be able to see everything in either group. Thinking of it this way led me to realize that sets are a great way to go.
Why?
- Sets can be set to conditional or Top 10 to allow us to create the first group.
- Sets can have multiple inputs, and we can allow our users to choose what goes into a set on the dashboard, allowing us to create our second set.
- Sets can be combined to meet the criteria we specified above.
Step 1: Create Your “Top 10” Set
First things first—we need to create a way set for our Top 10, so we can begin to create our Venn diagram above.
- Right-click on the dimension you’re going to create the set on (Country in our case).
- Click on Create then Set:
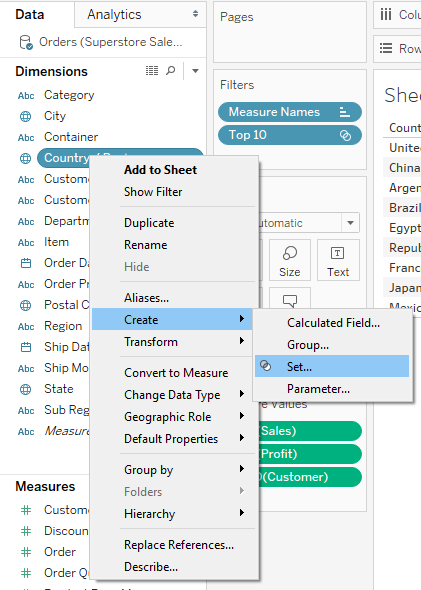
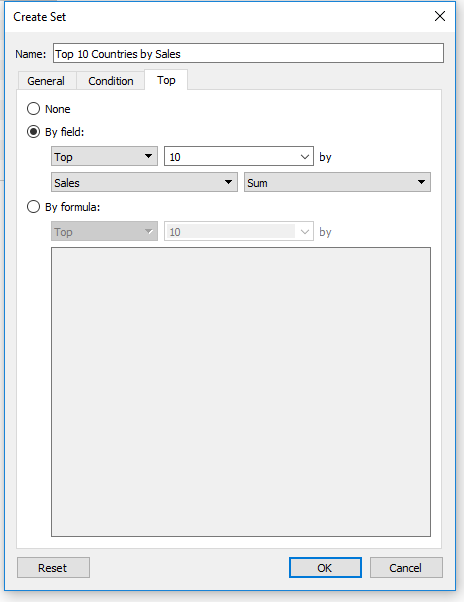
- Name it Top 10 [Dimension] by [Measure] which, in this instance, is Top 10 Countries by Sales.
- Select the Top tab and make it By field:
Step 2: Create Your “Specific Countries We Want to See” Set
We need to create a set that will include the Countries we want to add to our list. This is the second circle in our Venn diagram.
- Right-click on the dimension you’re going to create the set on (Country in our case).
- Click on Create then Set.
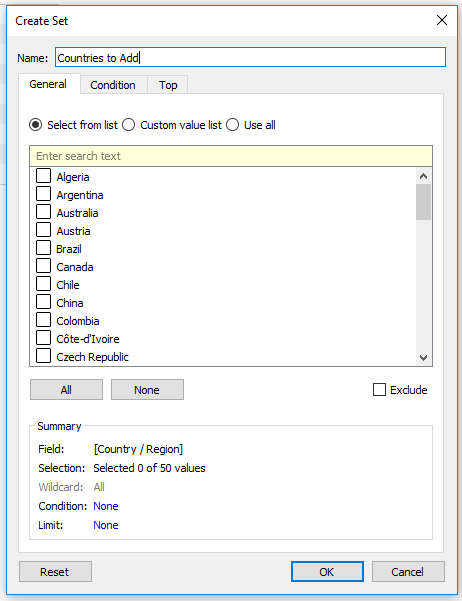
- Name it [Dimension] to Add (ex: Countries to Add).
- Leave it on Select from list, and make sure none is selected.
- If you’re uncertain and there are a lot to check, click on None to make sure:
Step 3: Combine These Two Sets
This will be our combined list of the Top 10 Countries, as well as any Countries we want to see in our list. In other words, it’s our two circles together, so the entire Venn diagram!
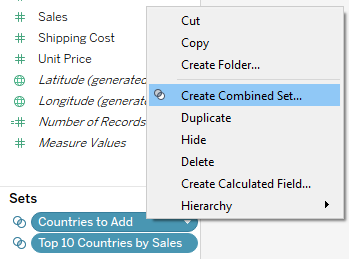
- Select both of the sets by holding Ctrl and clicking on both.
- Right-click on either of the sets. It doesn’t matter which one!
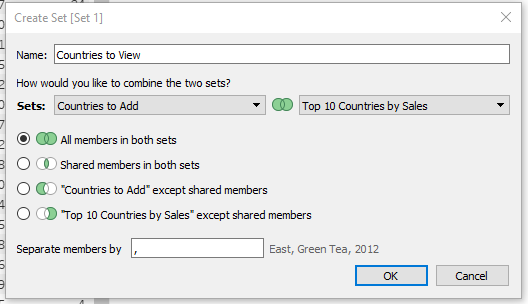
- Select Create Combined Set…
- Name it [Dimension] to View (ex: Countries to View).
- Make sure that All members in both sets is selected:
Step 4: Filter to See the Combined Set
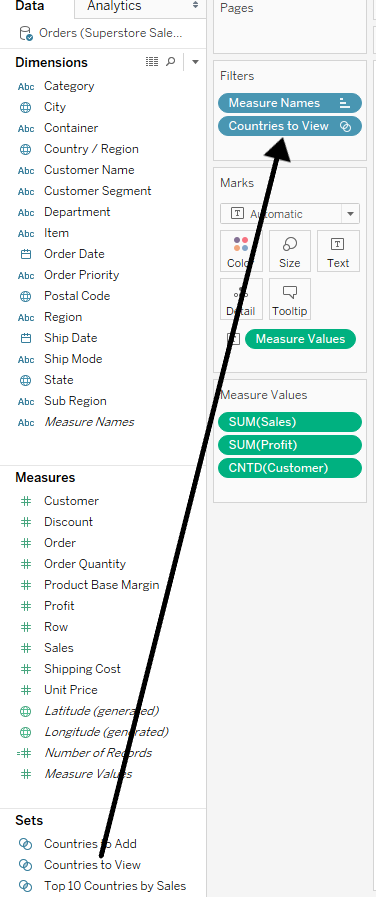
We want to only see the Countries that fall into our new combined set, so we need to filter by that set.
- Drag the Countries to View to your Filters card:
Step 5: Create a Way to Select Extra Countries
We’re most of the way there! However, we now need the option to select which Countries we want to add to the list. In order to do that, let’s create a list of all the Countries:
- Create a new sheet.
- Add [Dimension] to the Rows.
- Change the mark from Automatic to Shapes.
- Bring the [Dimension] to Add set to the Shape box in the Marks card—we’ll come back to this later.
Step 6: Put All of This Together in a Dashboard
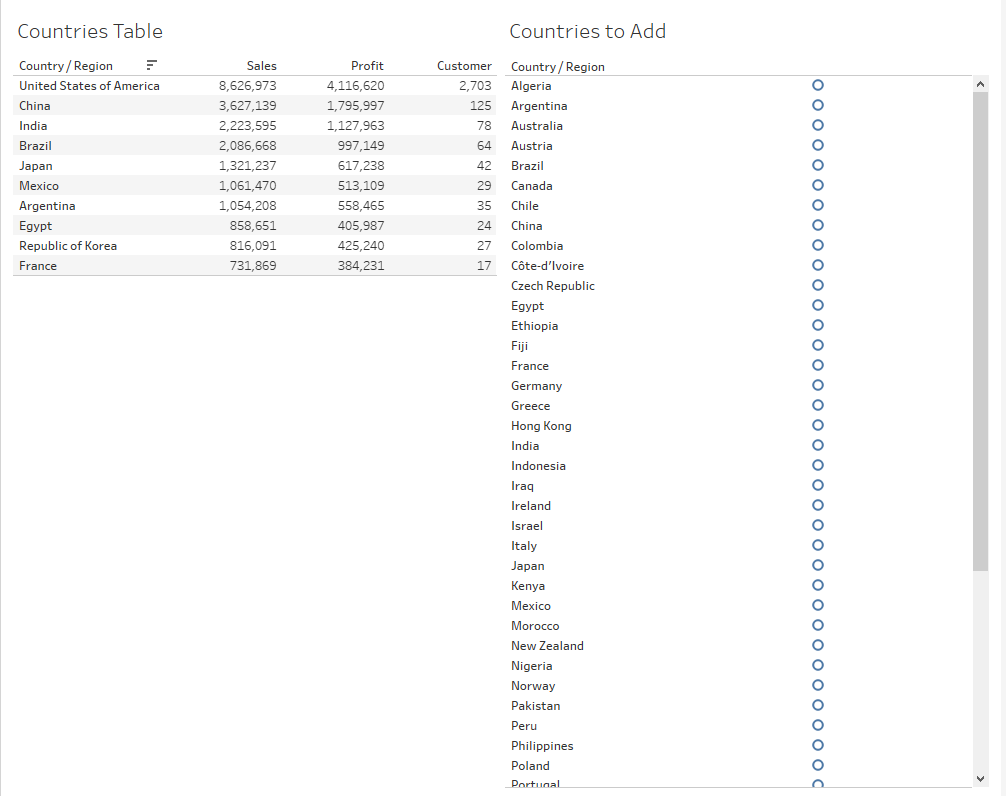
- Bring both of these sheets onto your dashboard:
Step 7: Create a Set Action
We now need to tell Tableau that we want our list of Countries to Add to control our Countries to Add set.
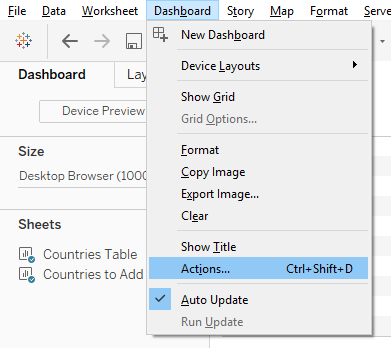
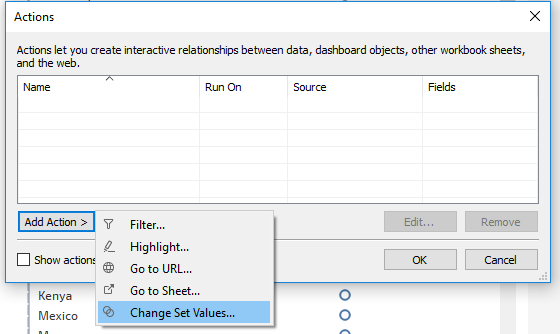
- Select Dashboard from your toolbar at the top and then Actions:
- Add a Change Set Values action:
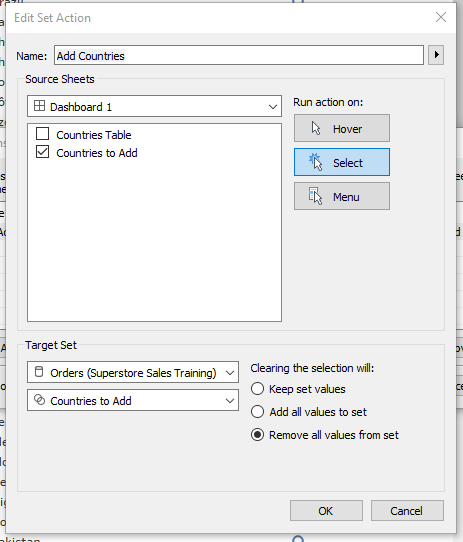
- The Source Sheet should be your Countries to Add sheet, and you should Run Action on Select.
- The next two options are to select the data source and the set, which is the Countries to Add set from the Superstore Sales Training data source.
- Make sure that clearing the selection will Remove all values from the set. This will leave the Top 10 Countries in the filter even when no Country to add has been selected:
Step 8: Select a Few Countries to Add to Your List
The shapes from Step 5 will now come into play!
- Hold Ctrl and select two or more Countries on the Countries to Add list, making sure to select the circles.
- Navigate to the sheet with your list of Country names.
- Click on the Shapes button on the Marks card.
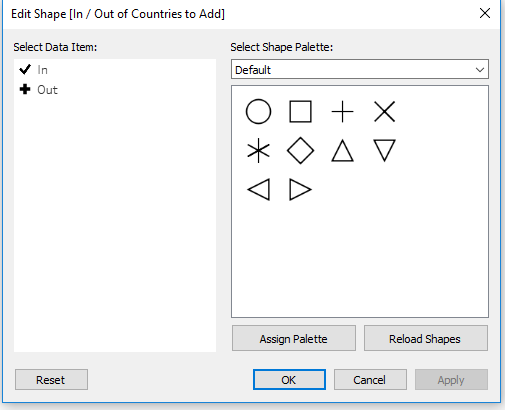
- Set the shapes for In and Out to whatever you want, keeping in mind that In means it was selected to add. I’ve set mine so that In is a checkmark, and Out is a plus symbol:
That’s it! You’ve done it! Now go back to your dashboard and play around, noting how selecting one of the countries adds it to the table (if it was not already in the Top 10).
Thank you, Tableau, for introducing set actions to my life.

