
Alteryx and Tableau are powerful tools that can revolutionize data analytics and data consumption in any organization. Alteryx is a user-friendly ETL platform with a powerful suite of tools, including spatial and predictive analytics. Tableau is the best tool for sharing data in a dynamic visualization. The days of static cross-tabs are over. Consumers of reports want the ability to drill into the data. The partnership between Alteryx and Tableau allows the analyst to spend time analyzing, finding trends and utilizing their company’s data in a way that drives business decisions. Alteryx and Tableau seamlessly bridge the gap between transforming raw data and a finished, dynamic report. In this blog, we will cover how to transform address fields in Alteryx for Tableau.
Alteryx has many strengths. It is the best tool for analysts to use in regards to transforming, cleaning, calculating, joining and preparing data; however, it is not the best at displaying a final product. That’s where Tableau steps in. Tableau can be bogged down by very large data sets and is most efficient when these data sets are turned into a .tde (Tableau Data Extract). Alteryx can power through any amount of data and export that final product as a .tde for visual analysis and make the findings transparent, secure and dynamic for an entire organization.
Preparing Address Files in Alteryx for Use in Tableau
One example of using Alteryx as a tool for preparing data for visual analysis is with addresses. It should be noted that my background is in spatial analytics, and while Tableau’s mapping and geocoding functions are beneficial, they are not as robust as I would like (the ability to bring in shapefiles would be great). This is where Alteryx saves the day. Take, for example, a data set with addresses. Tableau will not recognize addresses as a geographical feature. Tableau will recognize and geocode some types of data including countries, states and cities. However, for more detailed points, one must use the latitude and longitude of a particular point for Tableau to recognize and plot these features on a map.
How many of you keep the latitude and longitude of every single address on file? Exactly. To transform raw addresses into a latitude and longitude format, Alteryx has a suite of address tools including CASS (used to standardize an address field to USPS standards) and Street Geocoder (used to create a spatial object and/or latitude and longitude for an address).
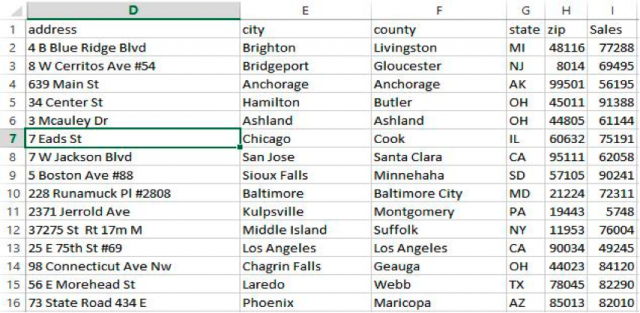
We will take this randomly generated customer sales list that includes addresses and sales:
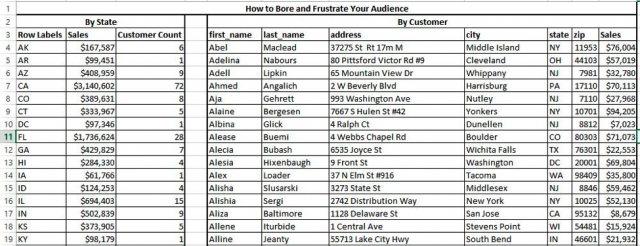
Say my end-user wants to view this data in two forms: Sales by State and Sales by Customer. I could produce a static cross-tab like this:
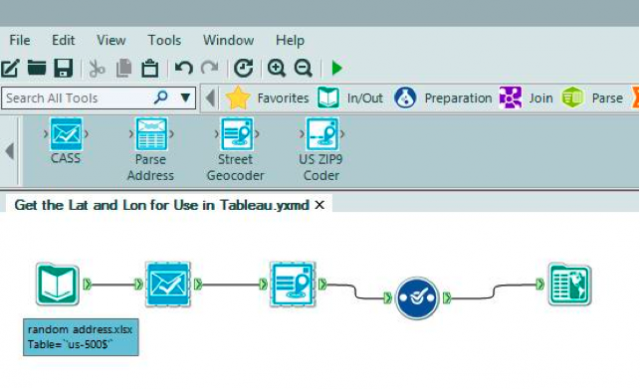
Or I could put this data into Alteryx and utilize the address tools to format it for a dynamic analysis within Tableau.
Alteryx Module:
The .tde I am saving looks like this:
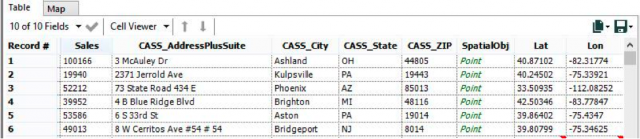
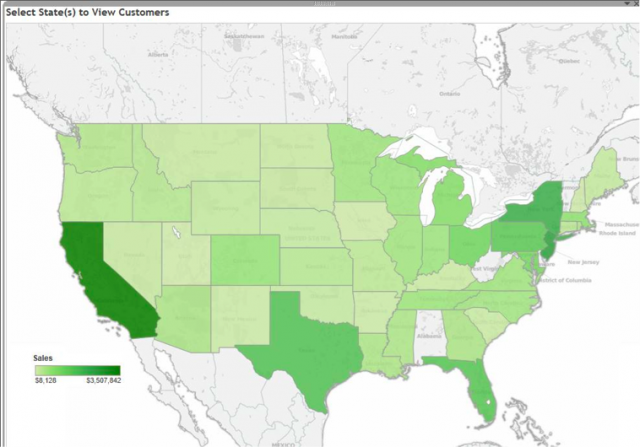
By doing this in Alteryx, we now have an address file that is up to USPS standards (CASS), the latitude and longitude for every address, and the ability to map these points and display them in Tableau. Saving as a Tableau Data Extract will increase performance in Tableau when I put this data into a dynamic dashboard. I will have two dashboards: One that displays Sales by State (with states colored by the sum of sales) and another that displays Sales by Customer (with graduated symbols to reflect the total sales to that customer). The consumer of this dashboard will be able to select a state, and after doing so, a separate map of all customers in that state will populate the dashboard through an action command in Tableau.
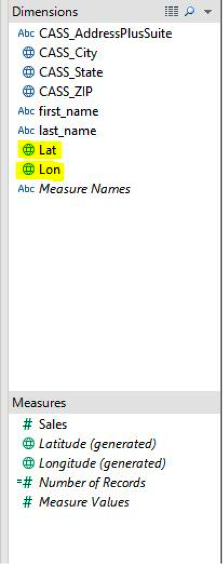
Tableau recognizes the new Lat and Lon field from Alteryx as a Measure. They should be dragged up to the Dimensions field instead so they operate as a discrete field.
One view is made with State and Sales (Tableau automatically recognized state and aggregated sales by state) and another view with the Lat and Lon fields from Dimensions. These points are sized by sales.
California is selected and the title of the Sales by Customer dashboard is automatically populated to reflect the selection:
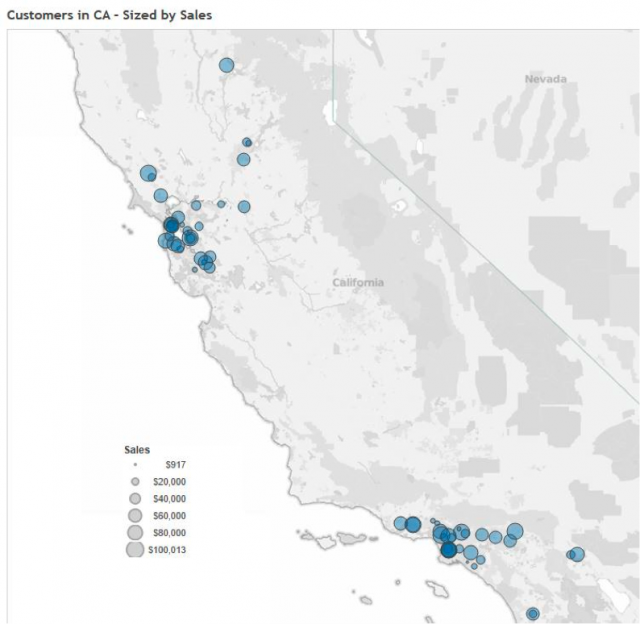
The consumer of this dashboard can then hover over each customer to activate the Tooltip in Tableau, displaying the information for that customer such as name, address and sales.
This is just one example of utilizing Alteryx to prepare data for analysis in Tableau. Any module built in Alteryx can be put on a scheduler to run when the raw data is updated. After the module is built and the finished product exported as a .tde, Tableau Server could host these Tableau Data Extracts. An analyst would use the .tde to create dynamic dashboards hosted on Tableau Server. The dashboards would automatically update as the data is updated and send to the server from Alteryx, thus freeing up time for the analyst to analyze and not create new reports every time data is updated.