When you think about “time,” what do you think of? Google generates time as an analogue clock face. Reading the orientation of the two clock hands is one the first skills we learn, even in the digital age. So, why not utilize this cognitive consonance when designing your beautiful data visualisations in Tableau?
Trigonometry Meets Tableau
Designing circles in Tableau involves some trigonometry and even if you can remember the basics, it gets a bit tricky. This article will discuss the mathematics involved in basic terms and will derive the actual angles used for the more comfortable math fans out there. Also, the time component of your data is unlikely to always fit nicely within a twelve-hour period. So, visualisations can quickly become verbose or unintuitive. You’re left with three choices:
- Have two clock faces symbolising a.m. and p.m.
- Use a 24-hour clock face
- Find some way of encoding a.m. and p.m. on one clock face
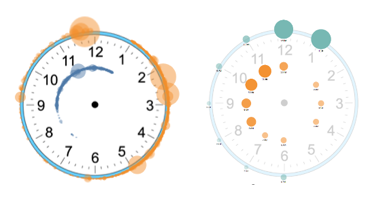
Since option A isn’t the best use of dashboard space and option B is gross and silly, I’m going to show you how to have two distinct radii on your clock face for a.m. and p.m.
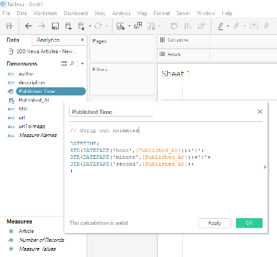
Step 1: Isolate Time
Let’s start by isolating the time of each event. In the example below, I have 100 news articles published across 10 online news outlets. First, isolate the time component of your date and time field into a new calculated field by constructing a new time component on its own:
Step 2: Fraction of the Day
Next, determine the resolution of your clock face. Do you want to show the hour only, or minutes and seconds in between? In this example, I’m going to show hours, as I want the number per hour to be a size variable in my final viz.
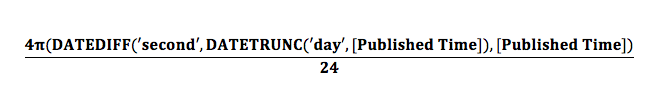
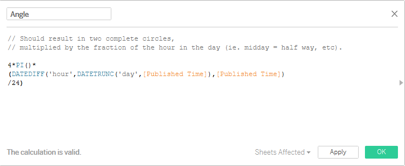
We want to multiply twice the entire circle (4π radians or 720°) by the fraction of the day our time represents. Tableau supports degrees and radians. Switch from one to the other with the RADIANS() and DEGREES() functions. The formula for our angle looks like this:
Step 3: X and Y Components
Next, we need to calculate our X and Y components to give Tableau something to plot!
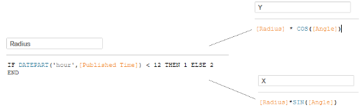
Using the parametric equation of a circle, we can simply create one calculated field for each with:
X = r * SIN([Angle])

Y = r * COS([Angle])
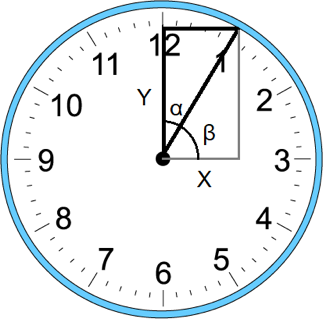
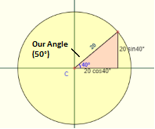
This part can trip some people up. Our angle is moving clockwise from midnight, not the usual Cartesian angle relative to X, which is back in time from 3 p.m.
Either use the formula as it stands below or check out my derivation at the end of the article:
At midnight and noon the angle is 0, Y is 1 and X is 0. At 3 a.m. the angle is π/2, y is 0 and X is 1.
Next, copy your X field and Y fields to the Columns and Rows shelves, deselect Aggregate Measures in the Analysis menu and hopefully you get a circle with 12 marks!
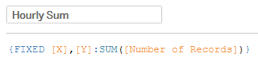
Now, we want to represent the number of items per hour as the size of the mark. Since we’ve disaggregated our measures, SUM(number of records) won’t help us. We need a level of detail calculation to force this aggregation at the hour level. So, for each X and Y value, give me the number of records, seen below:
Increase the size of the marks and you should have something that looks like this:
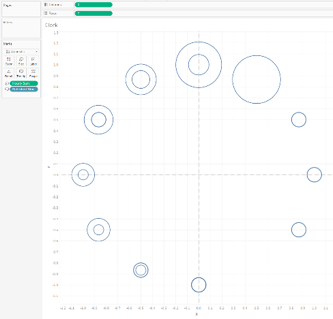
It’s beginning to take shape! We see there are now two circles per hour section on our clock. Now, we need to split these into a.m. and p.m.
Step 4: How to Split the Clock
Create another Calculated Field and check whether the hour is less than 12. If it is, set the value to 1 as demonstrated. We want this to be a number, because it’s going to act as our radius component to our Xs and Ys. But we also want discrete because there needs to be two specific colours for a.m. and p.m. We also want to be able to edit the aliases, so it needs to be a dimension.
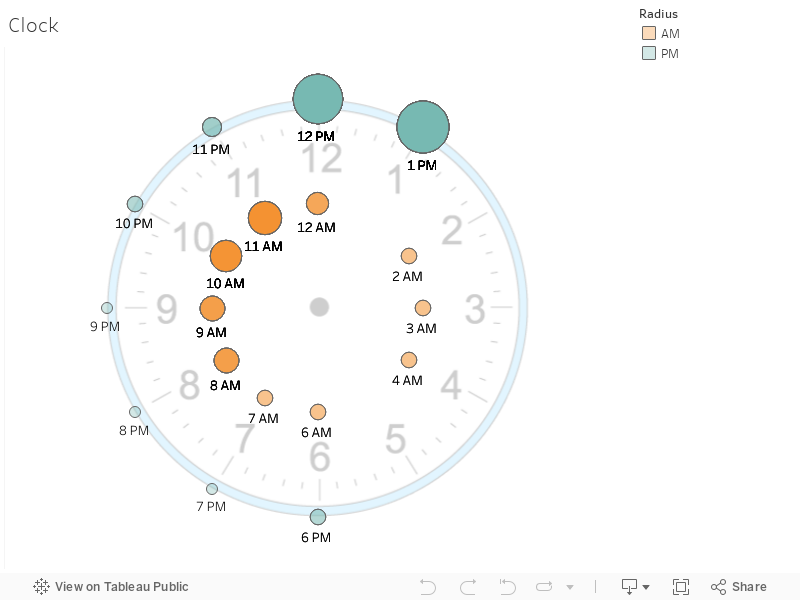
Once X and Y are updated with this Radius value, copy Radius to the colour shelf and edit the aliases of 1 and 2 to be a.m. and p.m. You may wish to fix the axes if your circle doesn’t look right.
Step 5: Adding the Clock Image
Finally, we need to add the background image. Navigate to the image of the clock in the file browser within the Add Background image window. Next, set the axes values. The centre of our marks X and Y values shouldn’t be any larger than 2 (radius times MAX(sin([Angle])). If we want the outside of the clock to represent p.m., set the X and Y axes to range from -2 and 2.
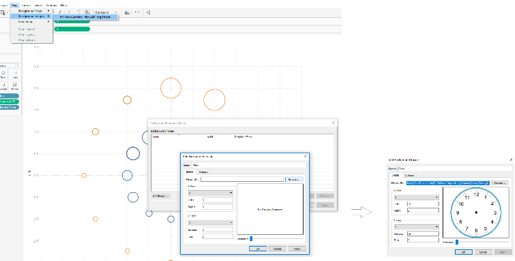
In my example, I have increased the washout of the image, hidden the axes and put a 12-hour formatted label on each mark.
Step 6: Dynamic Units of Time (Optional)
In the attached workbook, I have also included a parameter allowing the user to pick the resolution of their unit time between seconds, minutes and hours. This involves creating a parameter with the date options as the values (hour, minute, second) and a calculated field outputting the number of each unit in a day in a case statement.
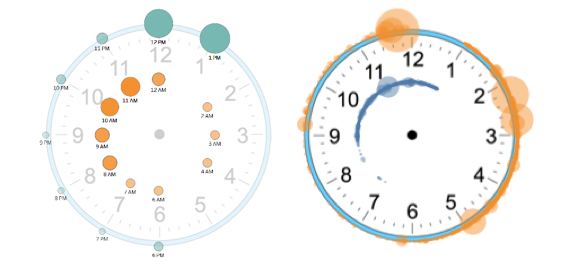
Step 7: Use Cases
The efficacy of each of these time units depends on the shape of your data and what you are using to size your marks. If it’s the number of records as shown, don’t aggregate per second. This level of granularity is useful if you want to see a spread of retweets. For instance, when the clock face is used as a timeline to show when the events are happening but not the trend, this would be the most ideal format.
And that’s all there is to it! Below you can get the full derivation formula. Get in touch with me if you have any questions or have tips you’d like to share.
Derivation
A = 90, B = α (Our Angle)
X = cos(A-B) = cosAcosB + sinAsinB
Cos(90-B) = cos(90)cosB + sin(90)sinB
=0*cosB + 1*sinB
= sinB = sinα
Y= Sin(A-B) = sinAcosB – cosAsinB
= 1*cosB – 0*sinB
= cosB = cosα