Since I have started using Tableau Prep, I can’t overstate how helpful it has been for cleaning, shaping and exploring my data before I start visualizing it in Tableau Desktop. However, one concept eluded me at first, and that was the Aggregate step. Why add an aggregate step if we can visualize our data at whatever level of granularity we want in Tableau Desktop?
When to Consider Aggregation
Tableau has a great blog post elucidating this concept. It explains that if we want to change the structure of the final dataset, we might have to change the level of aggregation in our view, but I would add that this becomes especially crucial when we combine one table with another or when we want to share that data outside of a Tableau environment.
Additionally, if you’ve ever created a calculated field in Tableau Prep, you might notice that you can’t create an LOD expression, nor is there a blend option available in our list of steps. For all these use cases, you might want to consider using an Aggregate step.
Note: This example uses the Sample Superstore data source available in your Tableau Desktop repository, as well as a file called “Sample Superstore Regional Goals.xlsx” that has been packaged in the flow.
A Use Case for Aggregation
I’ll use a common use case. Let’s say we have data detailing the purchases of our customers. I also have a data source, but I want to see a simplified view of the data that will answer the following questions: what is each region’s sales, who is its sales manager, and what is that sales manager’s goal? Seems straightforward enough … until you start previewing your data sources and realize how differently the data sources are structured.
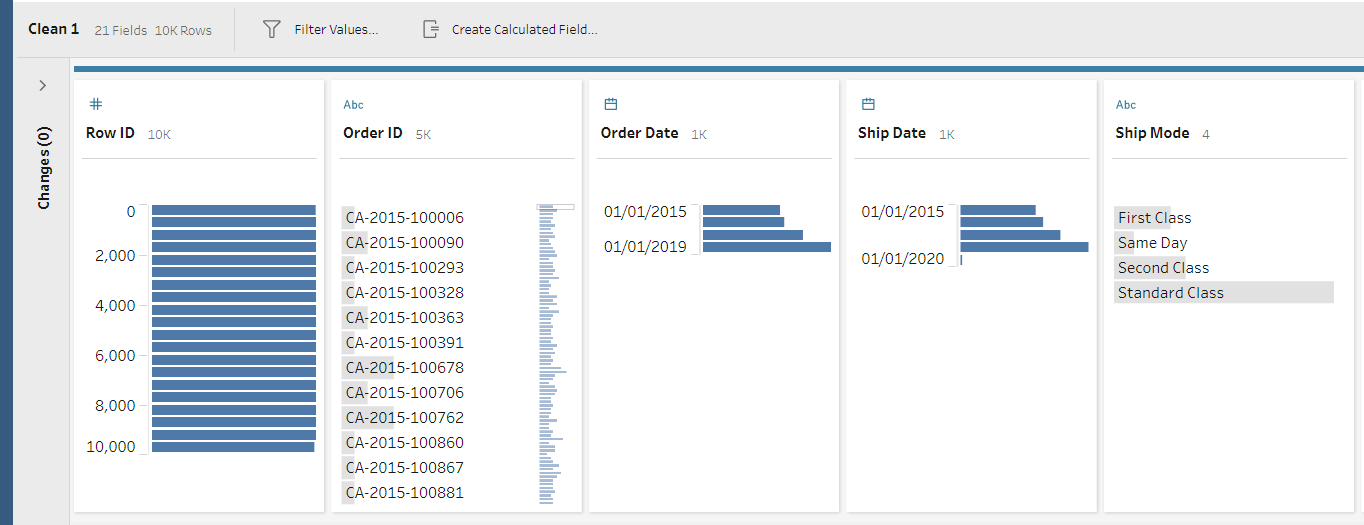
As you can see, our Orders table contains data for over 10,000 rows. Each row represents a different item in a customer’s order. This dataset also contains the Region for each order, which will be helpful since I want to visualize my Sales and Targets at the regional level:

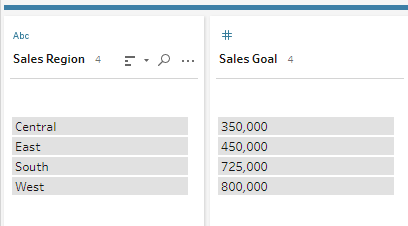
I also have my regional Sales Targets information in a different spreadsheet:

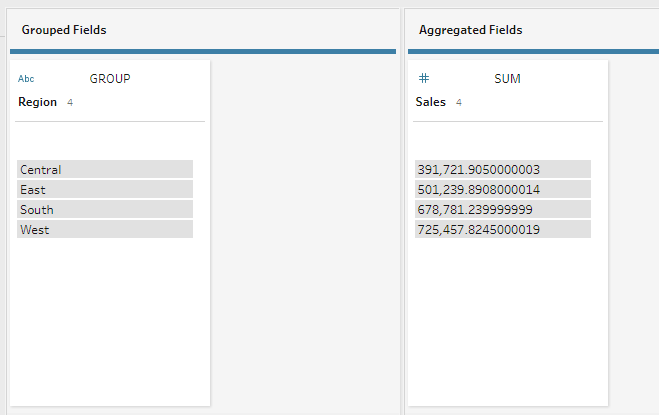
So what would happen if we joined these together and tried to visualize them in Tableau Desktop? Because our two data sources are at different levels of granularity, our Sales Targets would balloon—multiplying repeatedly for each row where that Region appeared. Since I want an output of just my Region, Sales and Targets columns, I know I will have to add an aggregate step for my Orders table, rolling up my Sales to the regional level:

Once I do that, it’s just a matter of adding a join step, and I can visualize my data exactly as I want. Because my two separate data sources are now at the same level of granularity, I will be able to get the desired output of Region-Sales-Sales Goal.
Yield the Best Output with Aggregation
This could be achieved with blending in Tableau Desktop or a Level of Detail calculation. But consider this: when you want to produce a clean, streamlined output in Tableau Prep, or that output might be consumed outside of Tableau Desktop (remember, you can export to a CSV!), adding an aggregate step is a must!

