
Note: A big thank you to Carl Allchin and Jonathan Allenby for initiating the Preppin’ Data project for our community.
Hunker down, folks. It’s time to prep some data. Welcome to my submission for the first week of the Preppin’ Data project. For beginners, the idea of preparing data can be intimidating. My hope is to provide insight into my process. There are certainly many ways to achieve the same data goals, but here’s where we started:
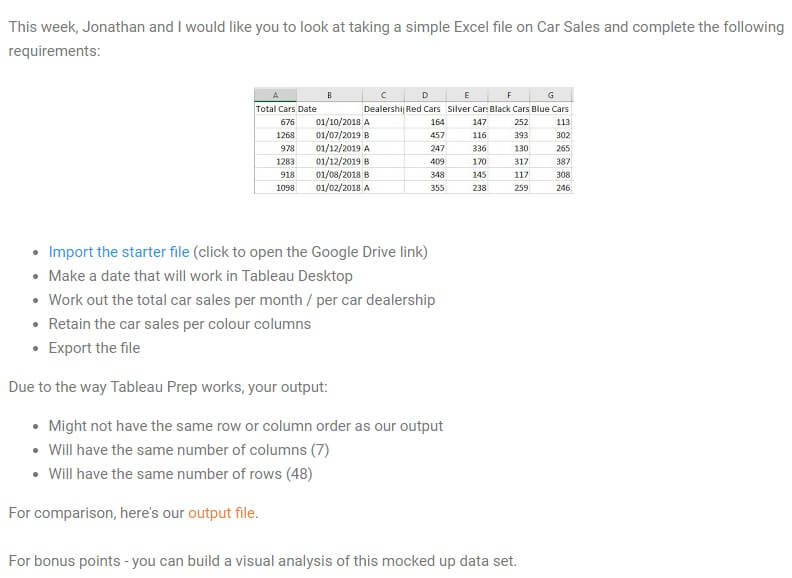
Above: Instructions from Week 1 of the Preppin’ Data Project
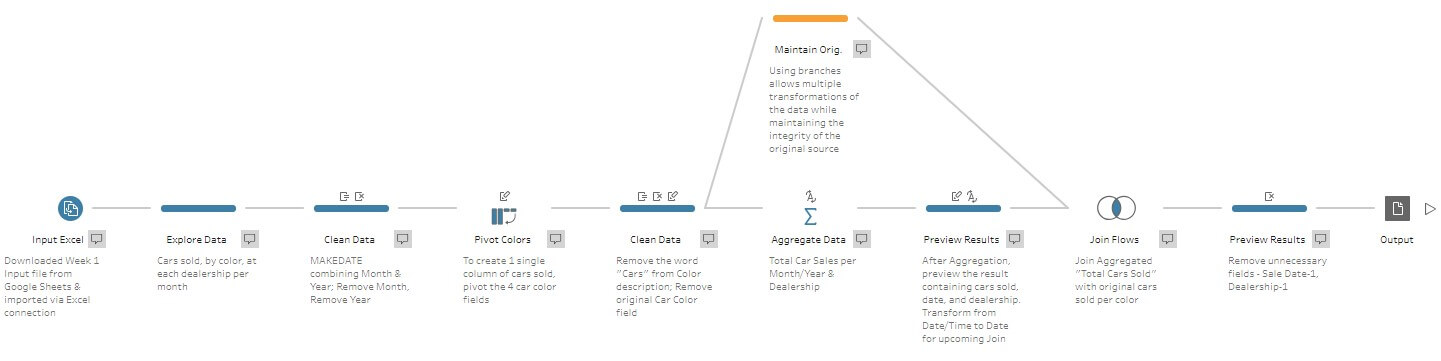
The Steps in My Data Prep Process
- Input Excel: The data lives on a Google Drive with the ability to download as .xlsx. I initially thought it’d be cool to connect directly to a Google Sheet of the info, but, alas, we don’t have that as a connector yet. If you’d like the ability to connect to Google Sheets using Tableau Prep, upvote this idea. In this scenario, I downloaded the data from Google Drive and connected via Excel in Prep.
- Explore Data: It’s a good practice to explore before making changes to your data to ensure you’re not duplicating efforts.
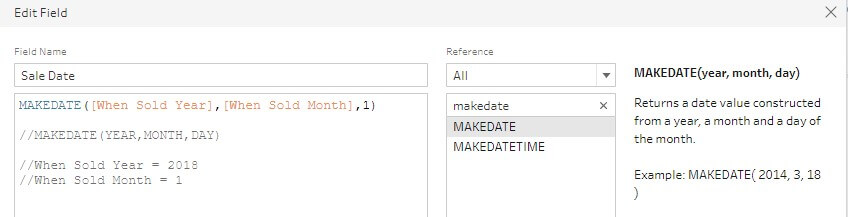
- Clean Date: I used Tableau’s MAKEDATE function to combine the When Sold Year and When Sold Month. After validating that the new date was reporting correctly, I removed the original two date columns:
- Pivot Colors: A clear beacon for pivoting occurs when you notice multiple columns representing very similar values (red cars, silver cars, etc.). I chose to pivot the data to have one column representing the number of vehicles sold, while another column described the vehicle color.
Note: This is the part where I did not read the Preppin’ Data instructions (oops). My third-grade teacher would be disappointed in me. In hindsight, since the instructions asked to retain the car sales per color columns, pivoting overcomplicated the result:
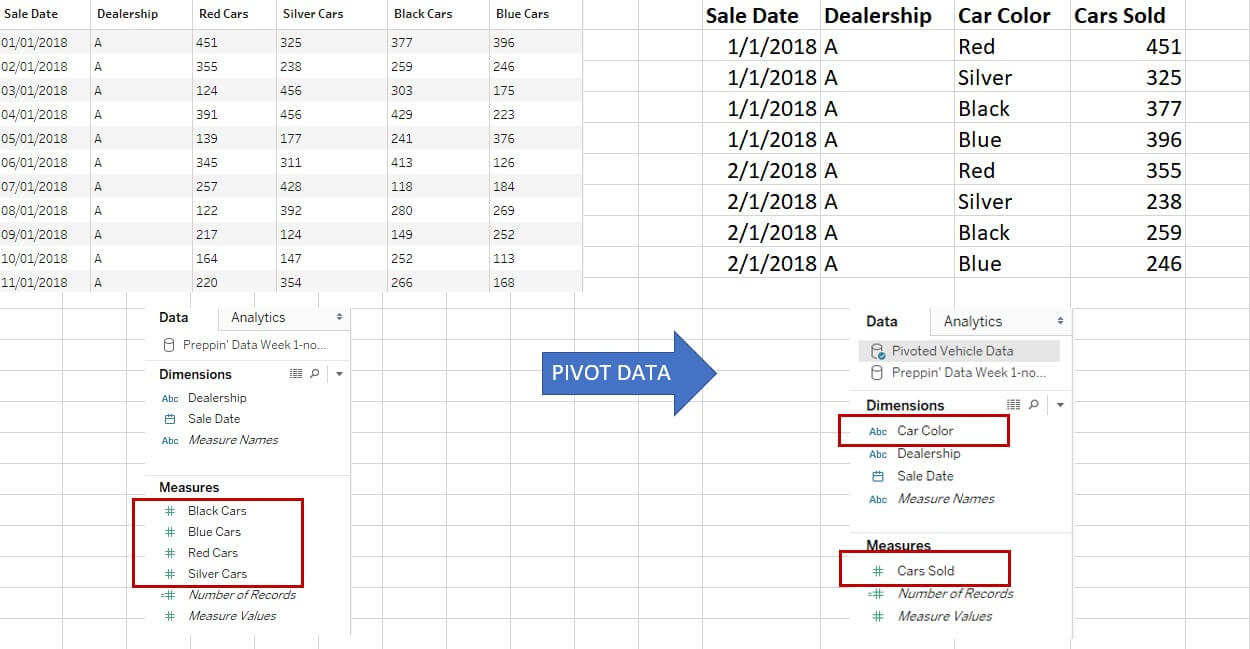
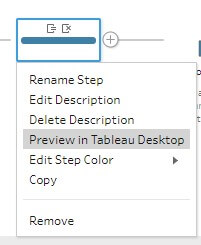
Tableau Prep Tip: Want to see what your current data structure looks like in Tableau Desktop? Right-click any step in the flow to preview in Tableau Desktop:
- Clean Color: Since I now had one column representing all car color types, I felt the word color included in each value was a bit repetitive. Using Prep’s Split functionality, I separated Blue from Blue Cars and then removed the original field.
- Aggregate Data: To achieve Total Car Sales per Month/Per Car Dealership, I knew the data must be aggregated. At the time, one row of information in the source described a dealership’s sales of a certain car color in a certain month (i.e. Dealership A sold 377 black cars in January 2018). I took a bit of liberty and assumed that per month/per car dealership meant the month/year (i.e. Jan 2018) instead of the summation of all years in a particular month (i.e. all Januaries).
- Preview After Aggregation: I like to perform a quick sanity check after any big data manipulation, and I’m glad to have noticed that Sale Date came through (to my surprise) as a datetime rather than date. This is significant because date was used later as a part of my join clause, so it’s important that the fields maintain the correct data type. Additionally, I recognized that the field created in the aggregate step was more aptly named Total Cars Sold than Cars Sold.
- Maintain Original: I made a decision at this point that, while I wanted to know the total cars sold per dealership per month/year, I also wanted to maintain each row individually so I could utilize the Color dimension. The challenge is that if a field is not used in the Aggregate step (like Color), then Tableau drops it from the flow moving forward. A workaround to this scenario is to branch off a copy of your original data and then join it back up once you’ve created the aggregate. In a way, you’re seeing both the Per Month/Per Dealership info AND the Per Month/Dealership/Car Color in the same data result.
- Join Flows: The common fields within the two flows were Dealership and Sale Date, so I knew those were going to be included in my join clause. An inner, left or right join would have given me the same exact outcome in this situation because the dealerships/sale dates came from the same original source.
- Preview Results: Since a join always brings ALL columns from BOTH tables, this caused two redundant fields: Sale Date and Dealership. After a quick clean-up, I’d arrived at my final result.
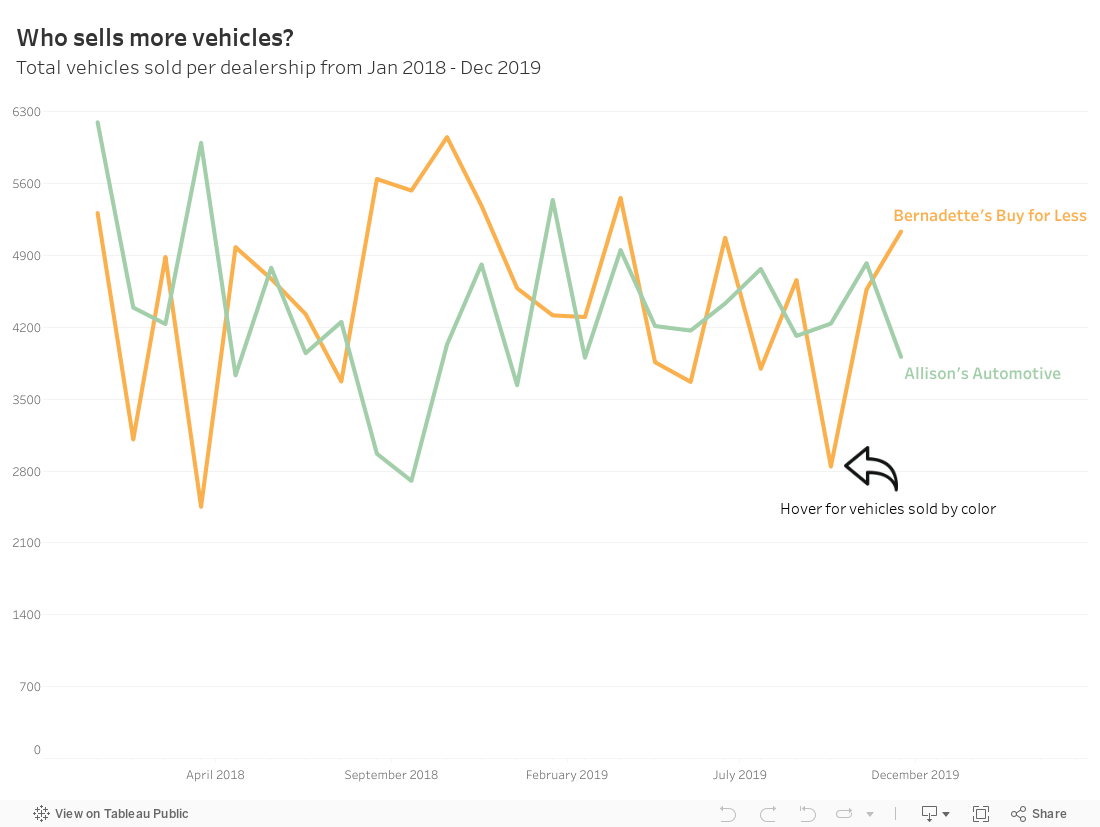
- Output: Oddly enough, I commonly forget to add an Output step. I guess I can relate it to climbing to the top of a difficult rock wall but forgetting to ring the bell at the end. I was curious to see how each dealership performed over time, as well as the breakdown in car colors over the same period. I added the Output step (CSV in my case), ran the flow to process the entire amount of data and then connected in Tableau Desktop to build this quick visualization:
Lessons Learned
- Tableau Prep changed the data type of my date field from date to datetime. I’m still not 100% positive why it happened, but my assumption is that it’s due to what my selection is in the Group by level date hierarchy.
- Read ALL of the instructions before tackling the problem. While I’m not disappointed with the opportunity to walk us through my approach, I recognize that my result is different than the solution. Additionally, the format of my result needs careful consideration when used in Tableau Desktop. Using the SUM aggregation when displaying the Total Cars Sold field could result in an inaccurate visualization.